Monitor & Run
The Monitor & Run page is your central hub for overseeing and managing all active process instances within a specific Softyflow project. This powerful interface provides a comprehensive toolkit for real-time tracking of process execution, diligent management of tasks, proactive handling of errors, and complete control over the instance lifecycle.
To get the most out of the monitoring features, it is recommended that you first familiarize yourself with deploying your applications, as well as understanding the fundamentals of your process design and associated web interfaces.
1. How to Access Project Monitoring
You can access the project-specific monitoring page directly when you are inside your project, navigate to the Run section from the project's main menu. This view is filtered to show only the instances and tasks relevant to the project you are currently working on.
1.1. Project Monitoring vs. Global Monitoring IDE
It's important to distinguish between project-level monitoring and global monitoring:
Project Monitoring (This Page): Provides a detailed, in-depth view of the processes and tasks within a single project. It is designed for developers and project managers who need to debug, manage, and track the lifecycle of instances specific to their application. You can inspect process schemas, view and edit variables, and manage individual tasks.
Global Monitoring IDE: Accessible from the Softyflow IDE, this page offers a high-level, cross-project overview of all instances running across the entire Softyflow environment. It is intended for system administrators and provides tools to filter by environment (Test/UAT/Prod), manage system-wide error notifications, and monitor the overall health of the platform. For more details, see the Global Instance Management documentation.
2. Comprehensive Overview
The Run page delivers extensive real-time monitoring capabilities, designed to give you a clear and immediate understanding of your operational landscape. The key features include:
- Process Statistics Dashboard: This provides an at-a-glance overview of all your process instances, neatly categorized into running, completed, and error states.
- Instance Management: You can efficiently search, filter, and manage every process instance, allowing for quick access and intervention when needed.
- Task Monitoring: This feature enables you to track the progress of individual tasks and dynamically assign them to different users and groups.
- Error Handling: Seamlessly view and manage any process errors, with direct access to detailed system logs for rapid diagnosis and resolution.
- Process Control: Take full command of your processes with the ability to start, pause, resume, and terminate instances as required.
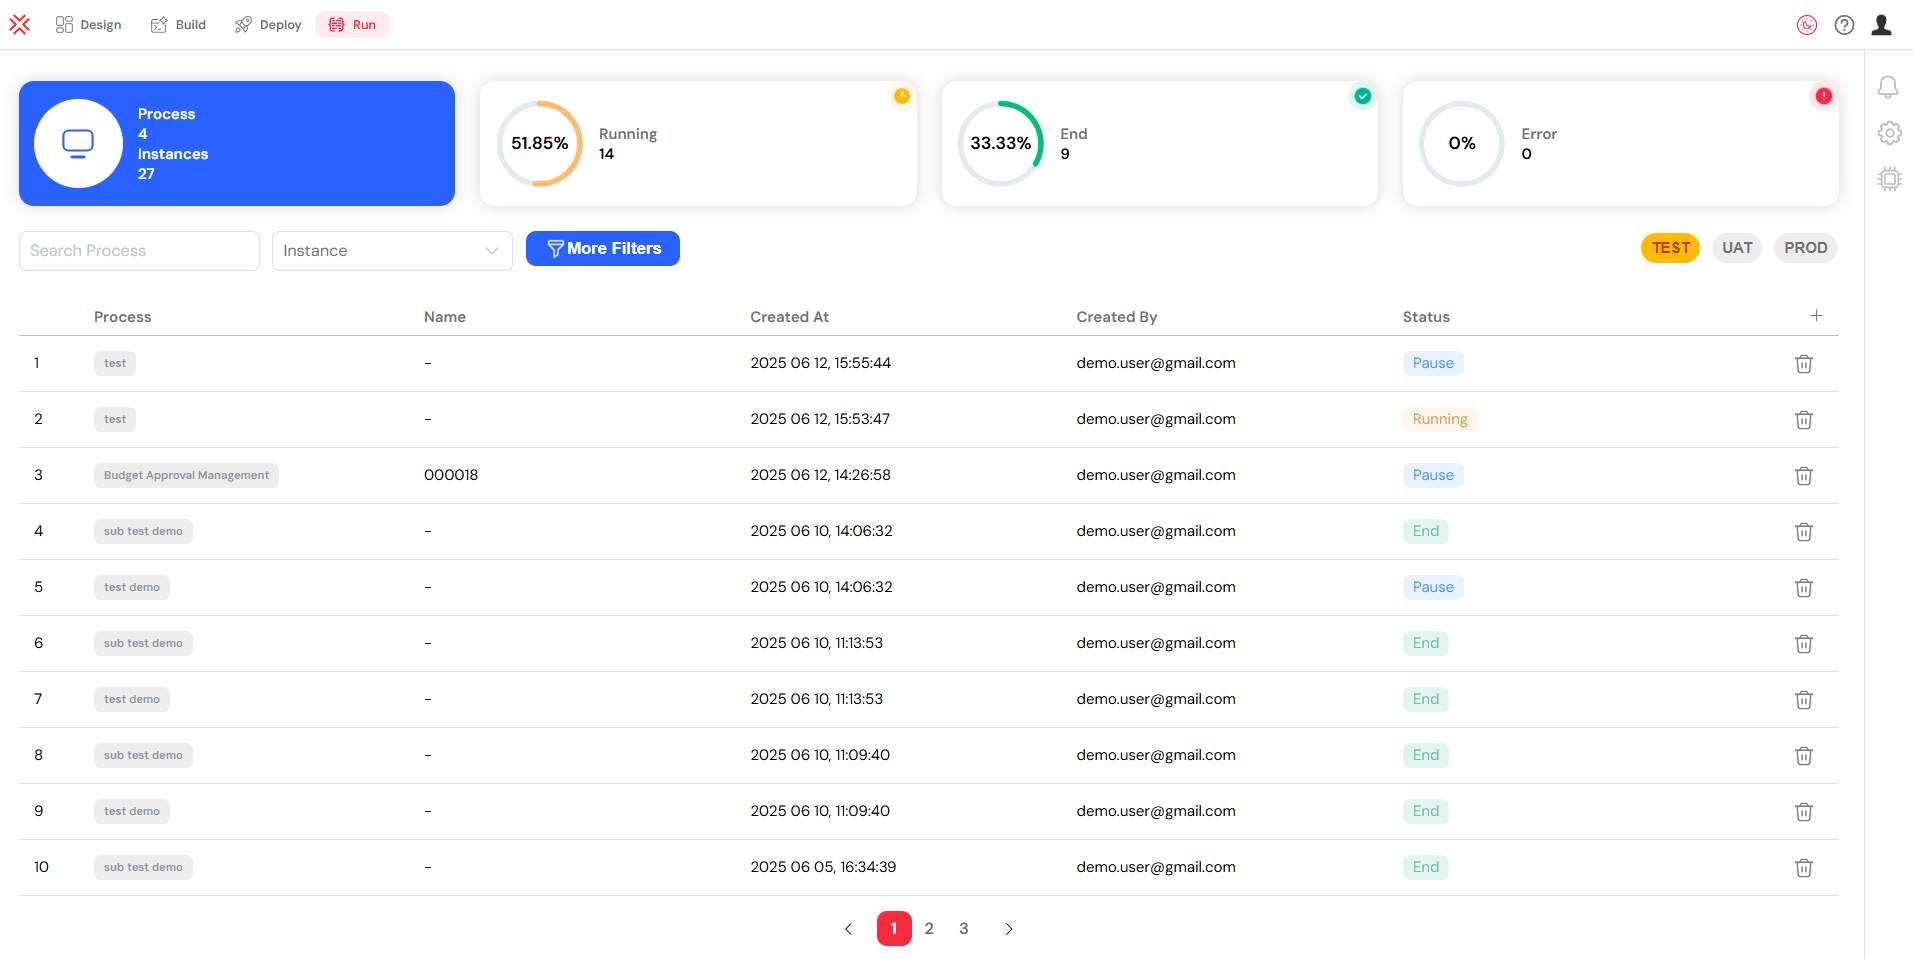
The Monitor & Run page provides a complete overview of all process instances.
3. Finding Launched Processes
3.1. Process Statistics Dashboard Explained
The dashboard at the top of the page presents crucial metrics to keep you informed of your system's health. These statistics include:
- Process Count: Displays the total number of defined processes and the aggregate number of all instances that have been launched.
- Running Instances: Shows the number of processes that are currently executing, complete with progress indicators for a quick visual status check.
- Completed Instances: Indicates the number of processes that have finished successfully, providing a clear measure of throughput.
- Error Count: Highlights the number of processes that have encountered errors, allowing you to focus your attention where it's most needed.

The dashboard provides a high-level view of process statistics.
3.2. Search and Filter Options
3.2.1. Basic Filtering Capabilities
The interface includes a set of intuitive basic filters to help you quickly locate the processes you need:
- Process Search: A convenient dropdown menu allows you to search for specific processes by name, narrowing down the list to focus on a particular workflow.
- Type Filter: You can switch between an Instance view, which shows overarching process information, and a Task view, which focuses on individual user tasks.
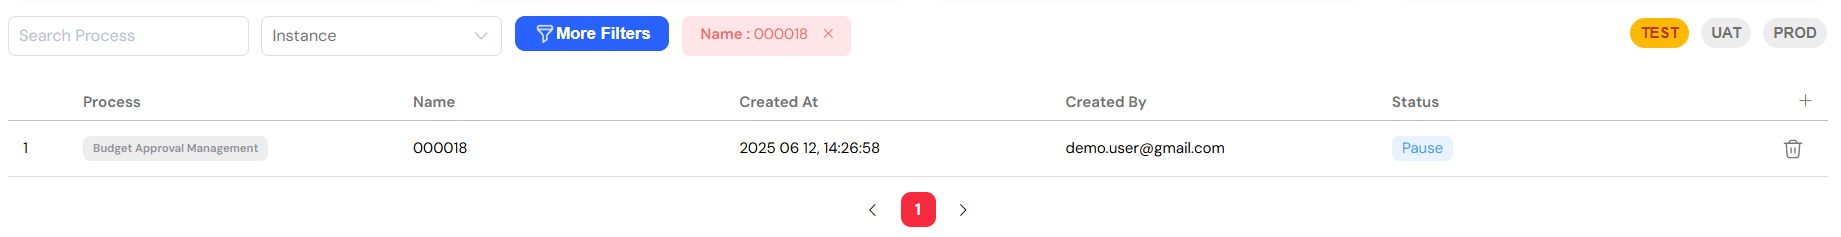
- Environment Mode: Easily toggle between your TEST, UAT, and PROD environments to monitor processes across different stages of your development lifecycle.
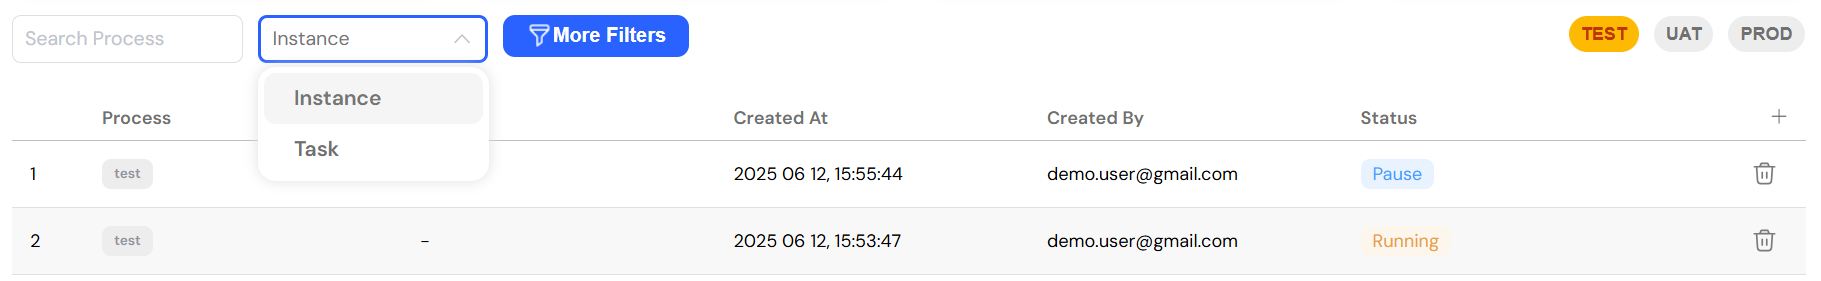
Use basic filters to quickly find processes by name, type, or environment.
3.2.2. Advanced Filtering for Granular Control
For more complex queries, clicking "More Filters" reveals a powerful set of advanced options, enabling highly specific searches:
- Column-based Filters: You can apply filters to any of the available columns in the instance table, allowing for precise data slicing.
- Date Ranges: Filter processes based on their creation date, completion date, or any other relevant timestamp.
- Status Filters: Isolate processes by their current status, such as Running, End, Error, or Pause.
- User Filters: Find processes assigned to specific users or initiated by certain creators.
- Custom Operators: Utilize a range of operators like "equals," "contains," "starts with," and "ends with" for fine-tuned filtering logic.
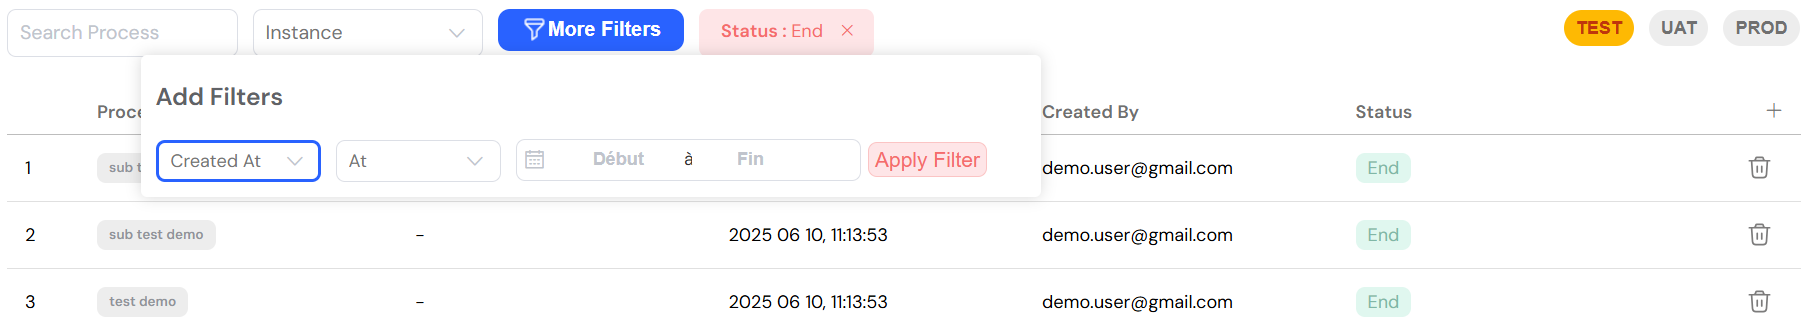
Advanced filters offer detailed control for complex process queries.
3.3. The Instance Table in Detail
The main table provides a dynamic and comprehensive list of your process instances. The key columns include:
- Index: A sequential number for easy reference and counting.
- Process Name: The name of the process, which is especially useful when you are not filtering by a specific process.
- Status: The current status of the instance, visually distinguished with color-coding for immediate recognition.
- Assigned Users: The users who are currently assigned to tasks within the instance.
- Custom Columns: The table is configurable, allowing you to add or remove columns to suit your specific monitoring needs.
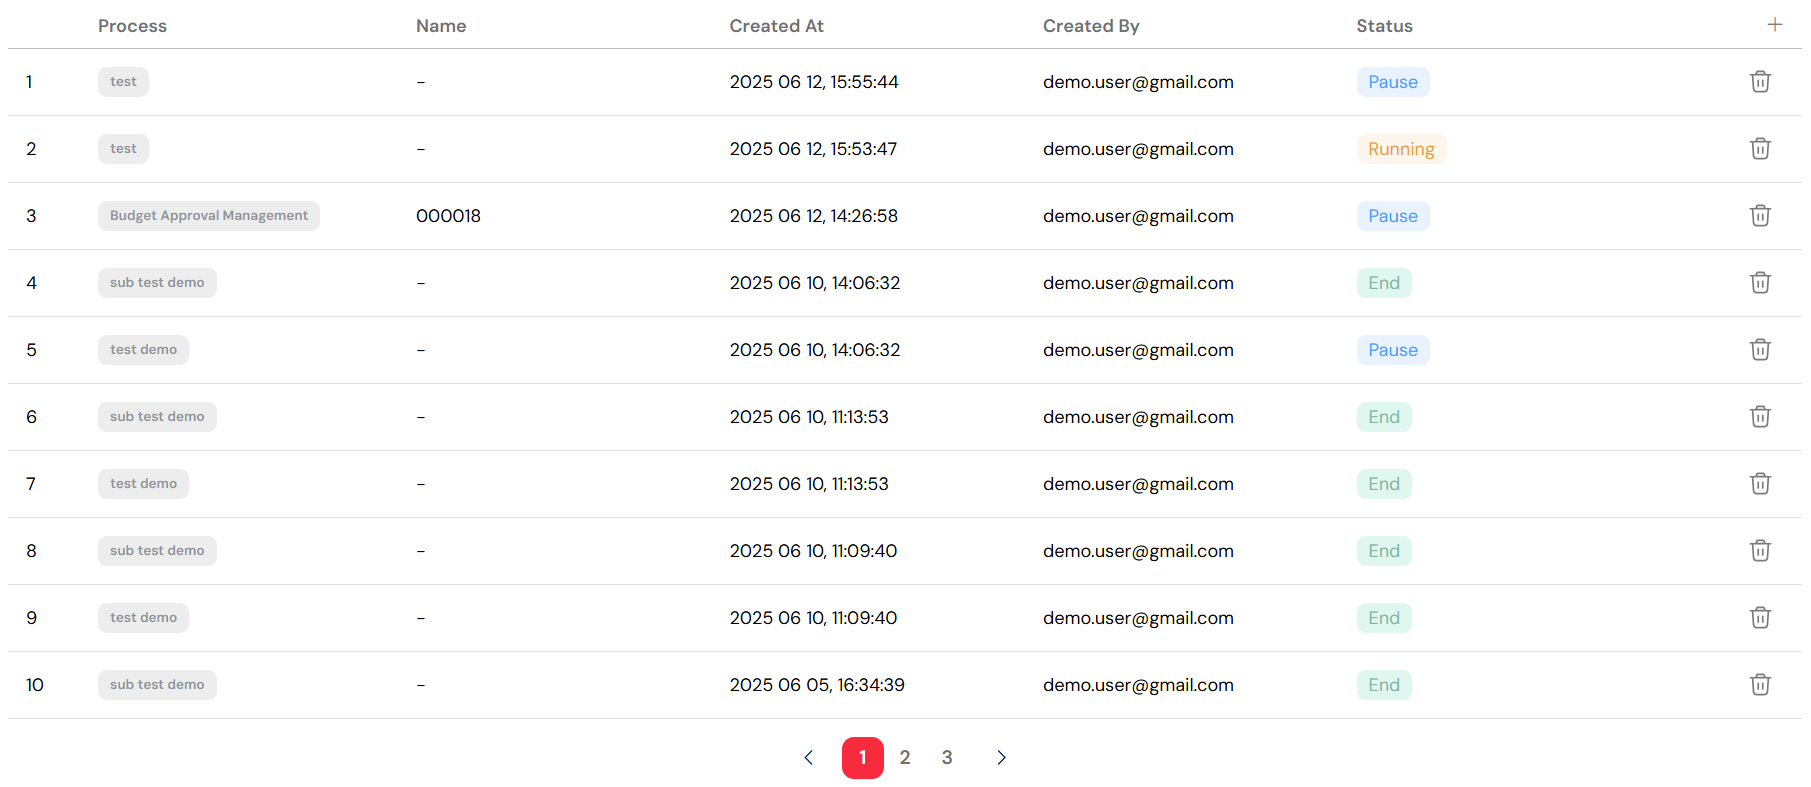
The instance table lists all processes with their current status and assignments.
4. How to View Errors
4.1. Error Statistics Dashboard
The main dashboard prominently displays the total number of errors, using clear visual indicators to draw your attention. By clicking on the error section, you can navigate directly to a filtered view that provides more detailed information about each error.
4.2. Instance-Level Error Identification
Errors are clearly marked at the instance level to ensure they are not missed:
- Error Badge: Any instance that has encountered an error will be marked with a distinct error badge.
- Error Details: Clicking on an instance with an error will take you to a detailed view where you can investigate the specifics of the error.
- Error Drawer: From the instance detail view, you can access the error drawer, which provides a comprehensive log of the error and its context.
4.3. Setting Up Error Notifications
To stay informed about errors proactively, you can configure notifications from the right-hand panel:
- Click the Notification icon located in the right toolbar to open the notification settings.
- Add Users: Select the users who should receive alerts when errors occur.
- Set Frequency: Choose whether to receive notifications on a Daily, Weekly, or Monthly basis.
- Save Configuration: Once you have defined your notification preferences, click "Save" to apply the settings.
5. Viewing Tasks and Assignments
5.1. Switching to Task View Mode
To focus on the individual tasks within your processes, you can easily switch to the Task view:
- In the filter dropdown menu, select "Task" as the type.
- The table will then display a comprehensive list of all tasks across all instances, along with their current assignments.
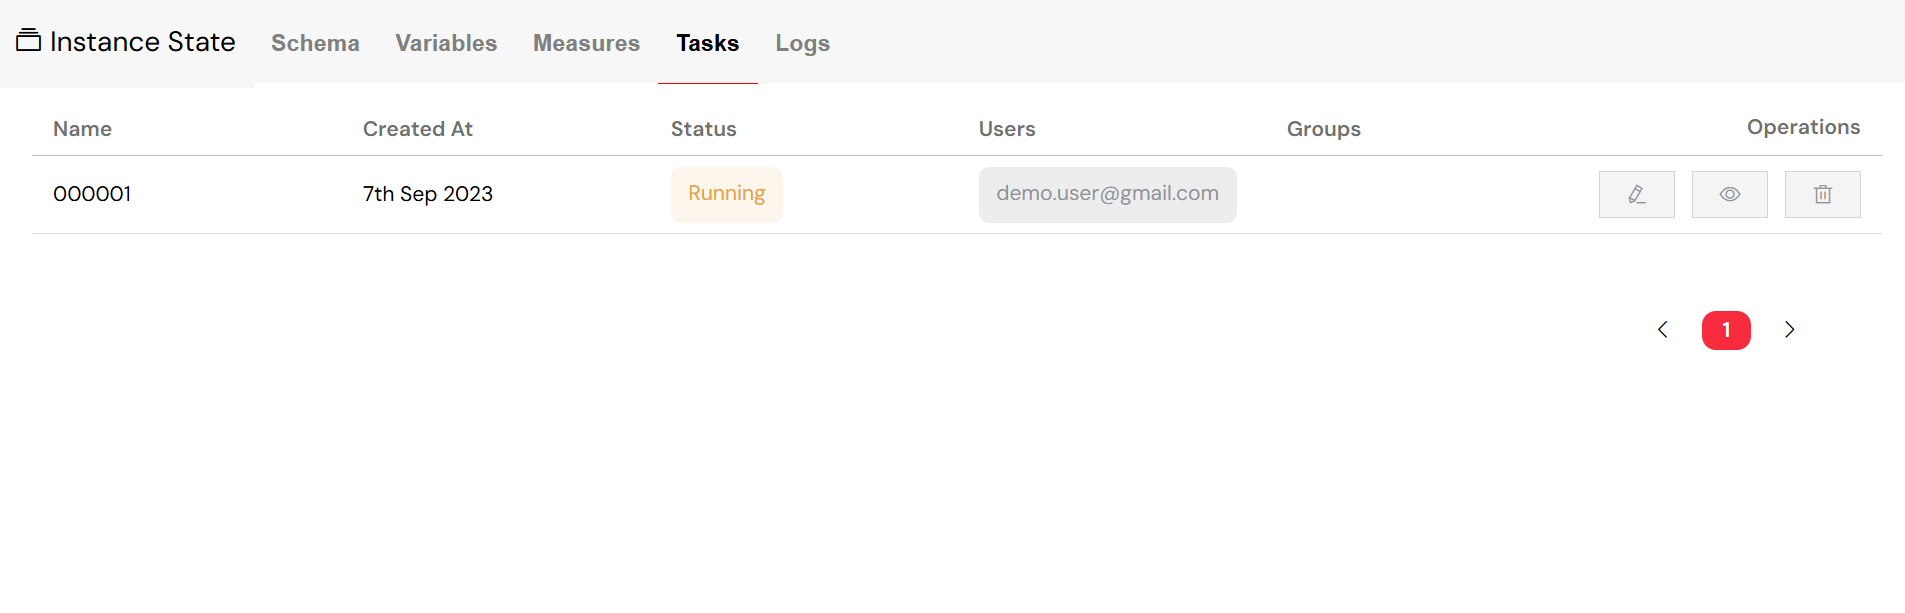
The Task view mode allows you to monitor all tasks and their assignments in one place.
5.2. Understanding Task Information
The task view provides detailed information about each task , ensuring you have full visibility into your team's workload. The available information for each task includes:
- Task Name: A descriptive name that clearly identifies the purpose of the task.
- Creation Date: The timestamp indicating when the task was created.
- Status: The current status of the task , which can be Running, End, or Error.
- Assigned Users: The individual users who are currently assigned to the task .
- Assigned Groups: The user groups that are assigned to the task , allowing for team-based task management.

Detailed task information helps you track assignments and progress.
5.3. Effective Task Management
From the instance detail view, you have several options for managing tasks :
- Edit Tasks: You can modify the user and group assignments for any task , allowing for dynamic workload balancing.
- View Tasks: Open the task interface to execute the task or review its progress.
- Delete Tasks: If a task is no longer needed, you can remove it from the instance.
Manage tasks by editing assignments, viewing details, or deleting them as needed.
5.4. The Task Assignment Process
Assigning tasks to users or groups is a straightforward process:
- Select Task: In the task list, click the "edit" button for the task you wish to reassign.
- Modify Users: In the assignment dialog, you can add or remove individual users.
- Modify Groups: Similarly, you can add or remove user groups to adjust team-based assignments.
- Save Changes: After making your modifications, click "Save" to apply the new assignments.
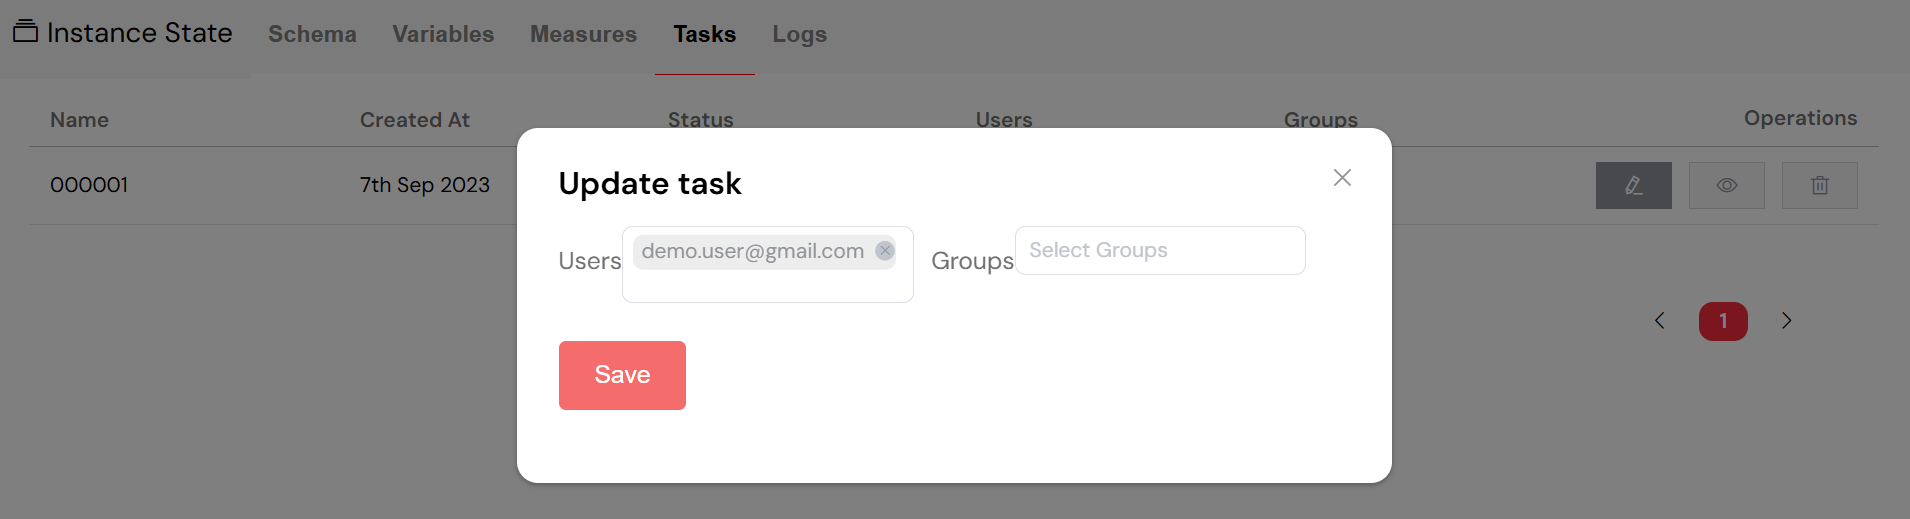
The task assignment process allows for flexible allocation of work.
6. How to Restart a Process
6.1. Reviving a Paused Instance
If a process instance has been paused, you can easily resume it from the point where it stopped:
- Open Instance: Navigate to and click on the paused instance to open its detailed view.
- Schema View: Go to the "Schema" tab, where you will see a visual representation of the process flow.
- Revive Button: In the toolbar, click the "play" button (▶️) to initiate the revival process.
- Select Activity: You will be prompted to choose the specific activity from which the process should resume.
- Confirm Revival: After selecting the starting point, click "Revive" to restart the process.
Reviving a Paused Instance.
7. How to Close a Process
7.1. Gracefully Ending an Instance
To ensure that a running instance is closed correctly and all associated data is properly handled, follow these steps:
Select the instance you want to close from the list.
- End Button: In the toolbar, click the "success" button (✓), which is used to end the instance gracefully.
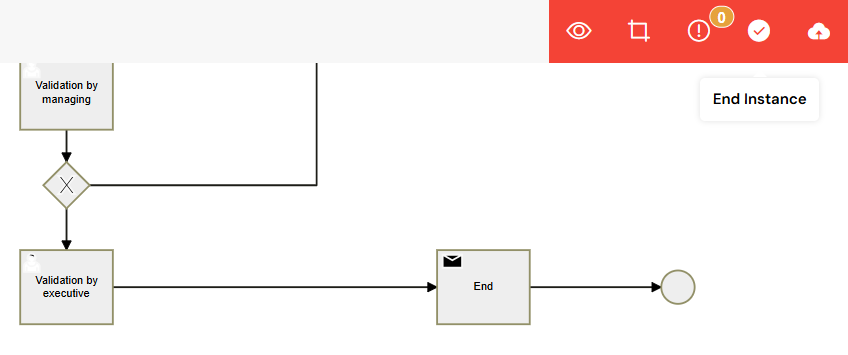
Click the 'End' button to initiate the closing process.
- Confirm Action: A confirmation dialog will appear, asking you to confirm that you want to end the instance.
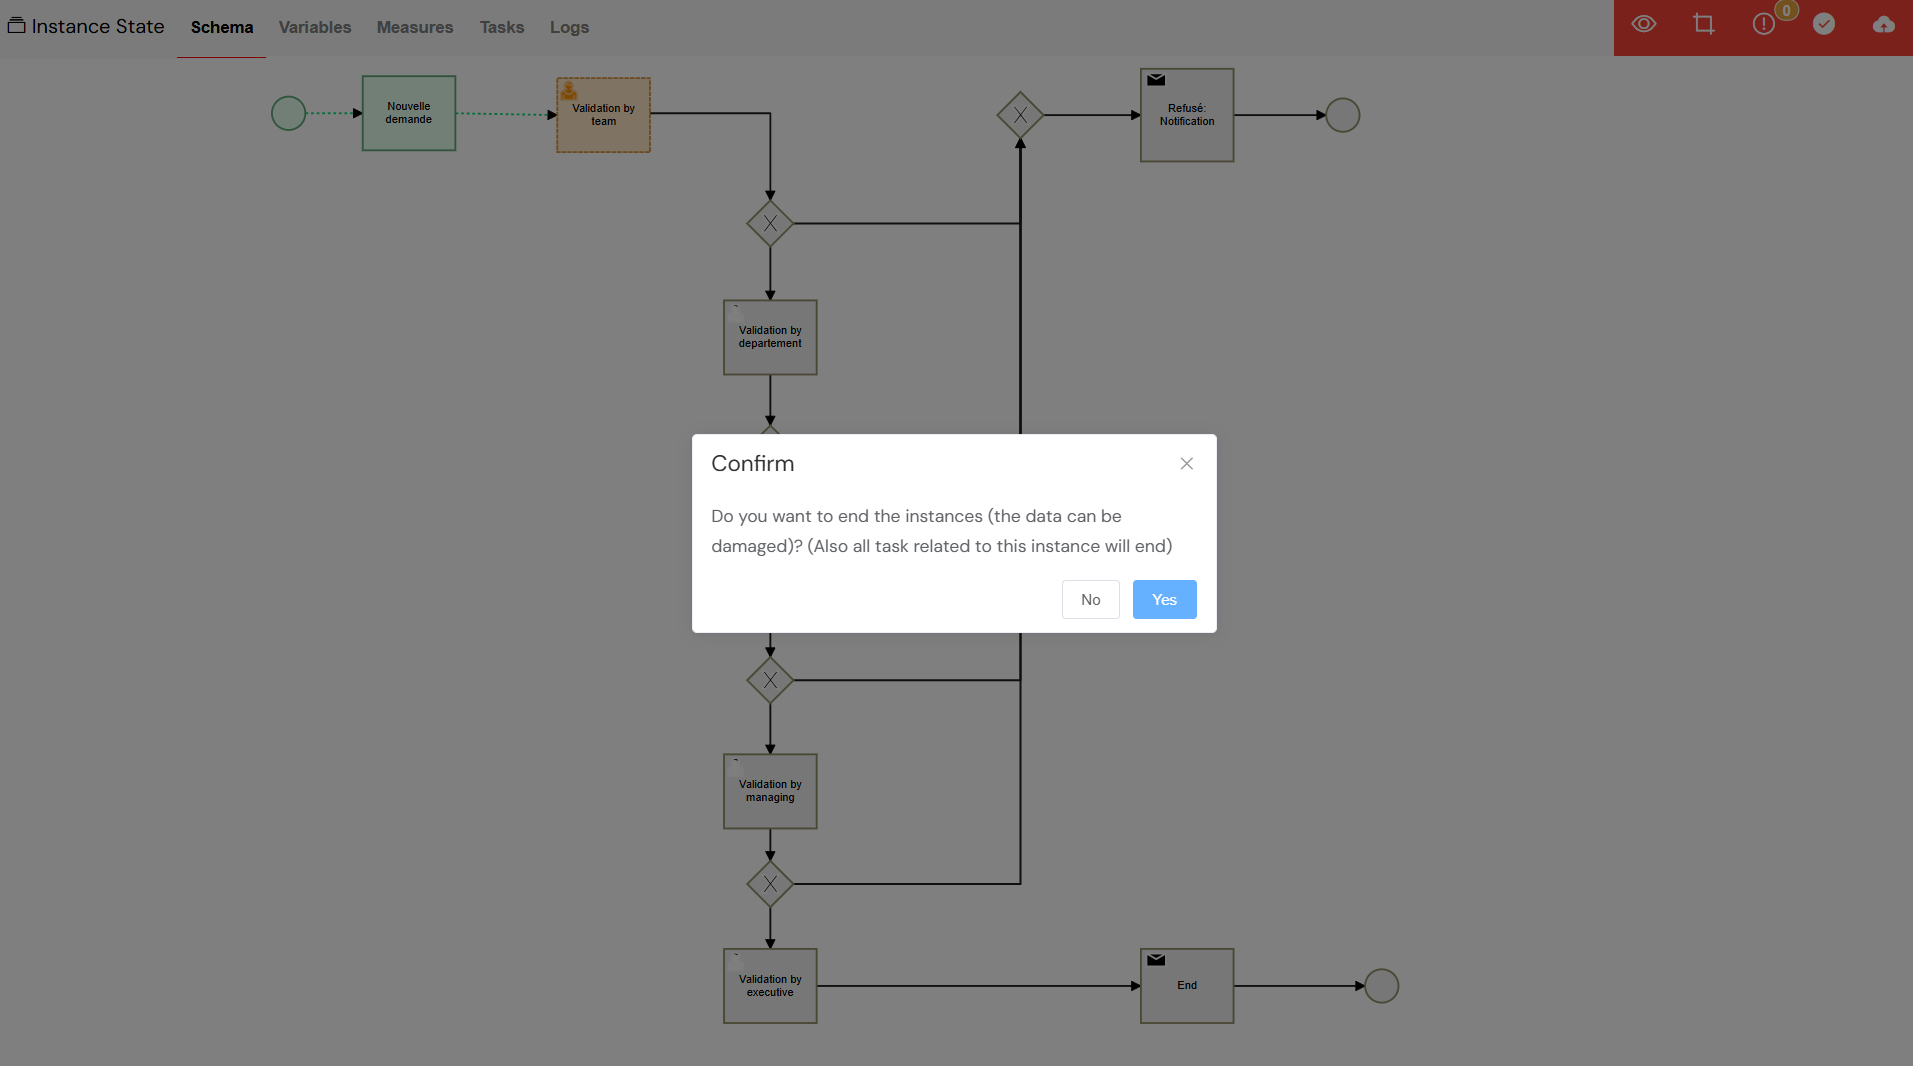
Confirm the action to finalize the instance closure.
- Automatic Cleanup: Upon confirmation, the system will perform an automatic cleanup, which includes:
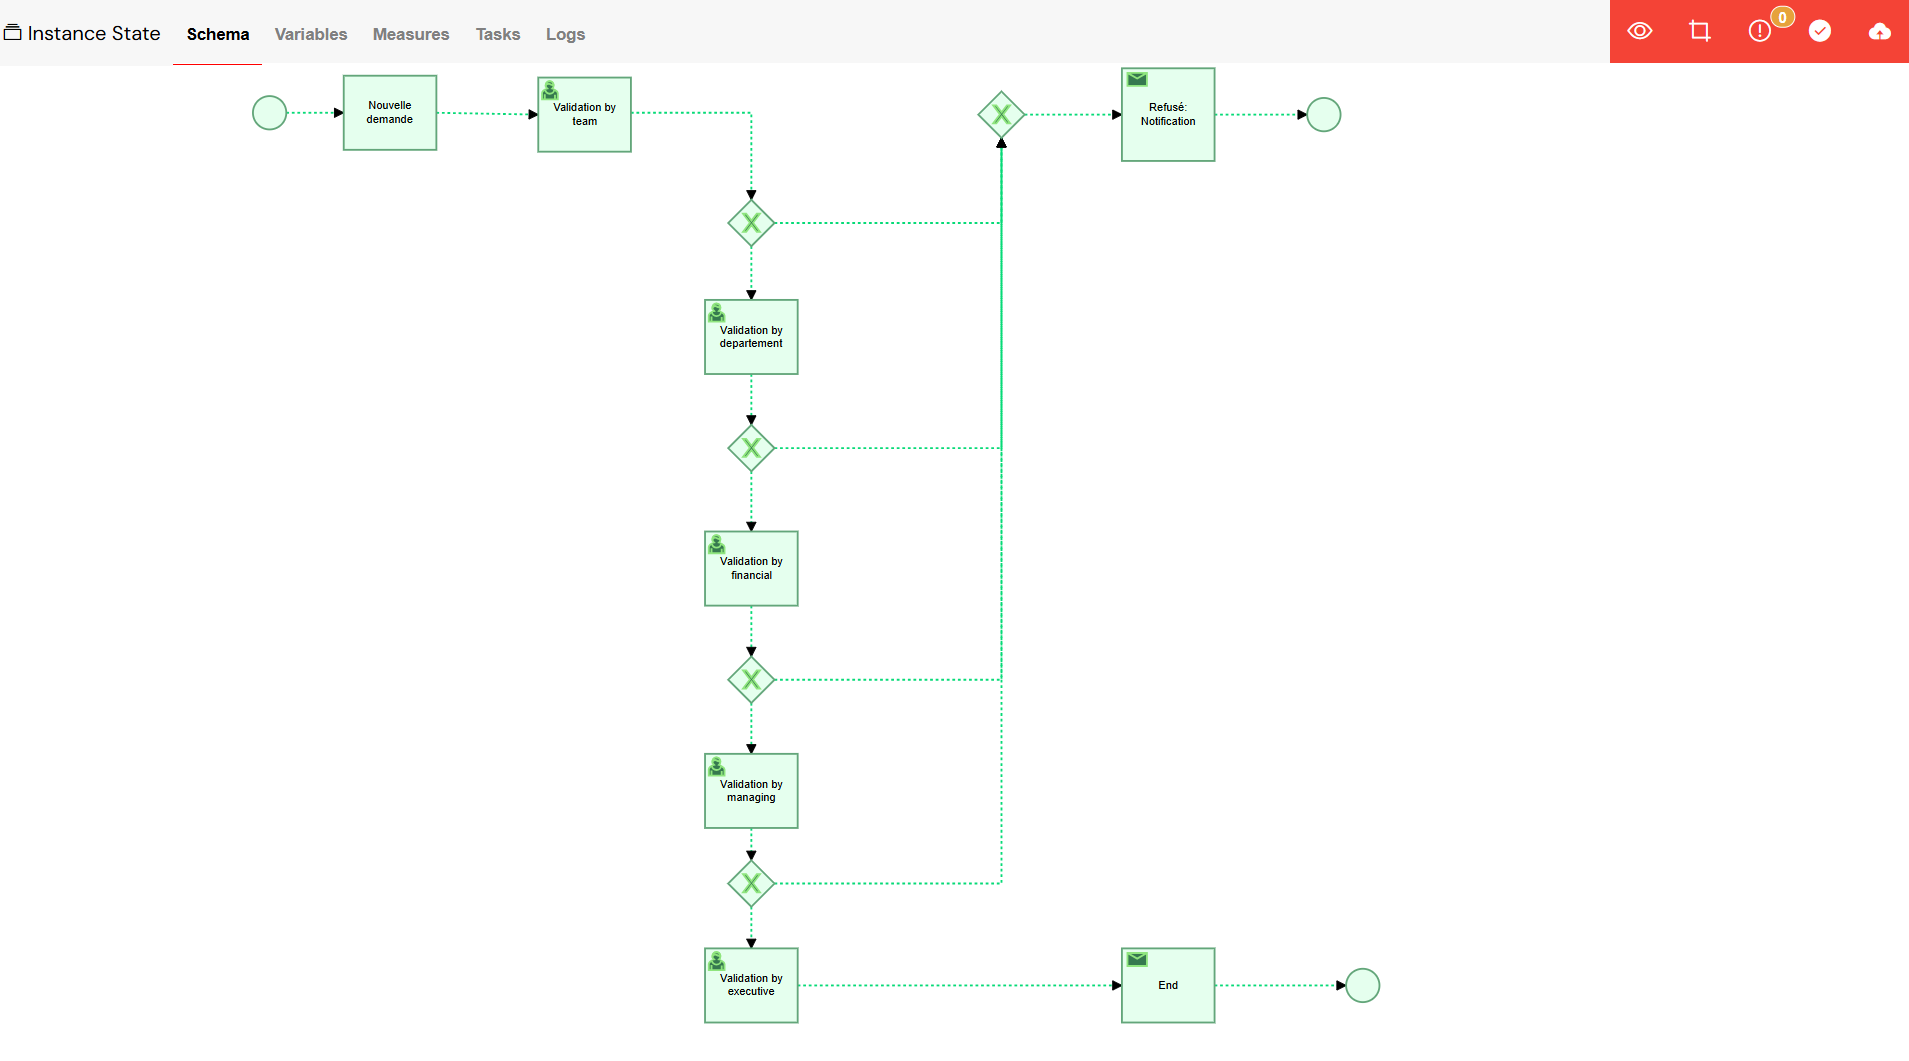
The system automatically handles cleanup after ending an instance.
7.2. Forcibly Terminating an Instance
In situations where an instance is unresponsive or problematic, you may need to terminate it forcefully. Be aware that this action can lead to data loss.
- Delete Option: In the instance table, use the delete button associated with the problematic instance.
- Confirm Deletion: You will be asked to confirm the permanent removal of the instance.
- Data Loss Warning: A warning will be displayed to remind you that forcible termination may result in the loss of data associated with the instance.
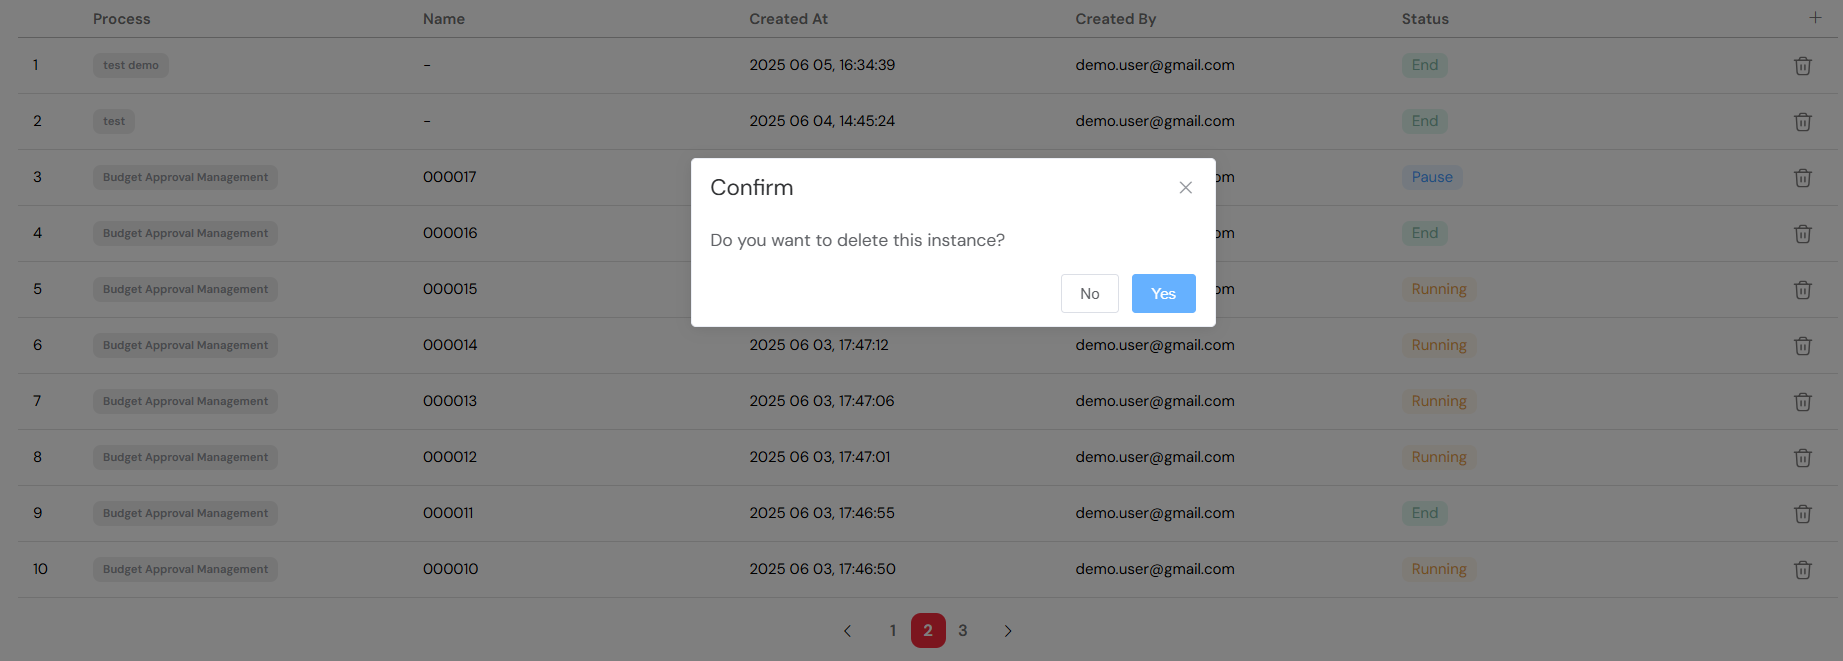
Force termination should be used with caution as it may lead to data loss.
7.3. Performing Bulk Operations
When you need to manage multiple instances at once, you can perform bulk operations, though each action is still processed individually:
- Filter Selection: Use the filtering options to create a list of the instances you want to target.
- Individual Actions: Perform the desired action (such as ending or deleting) on each instance in your filtered list.
- Monitor Progress: Keep an eye on the instance table to track the completion of your bulk operations.
Bulk operations can be performed on a filtered list of instances.
8. Instance Detail Views
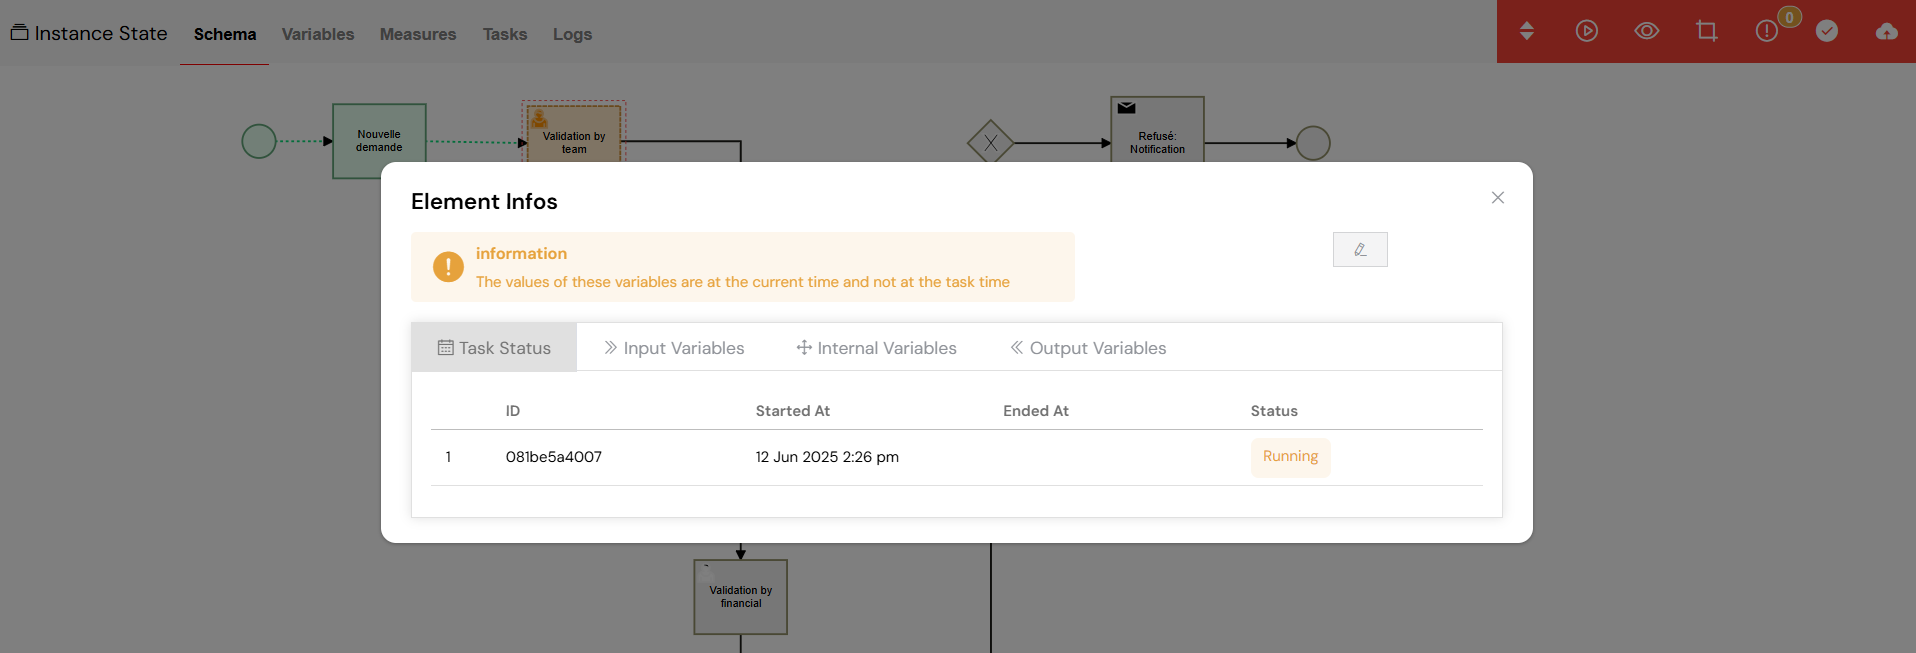
8.1. The Schema View
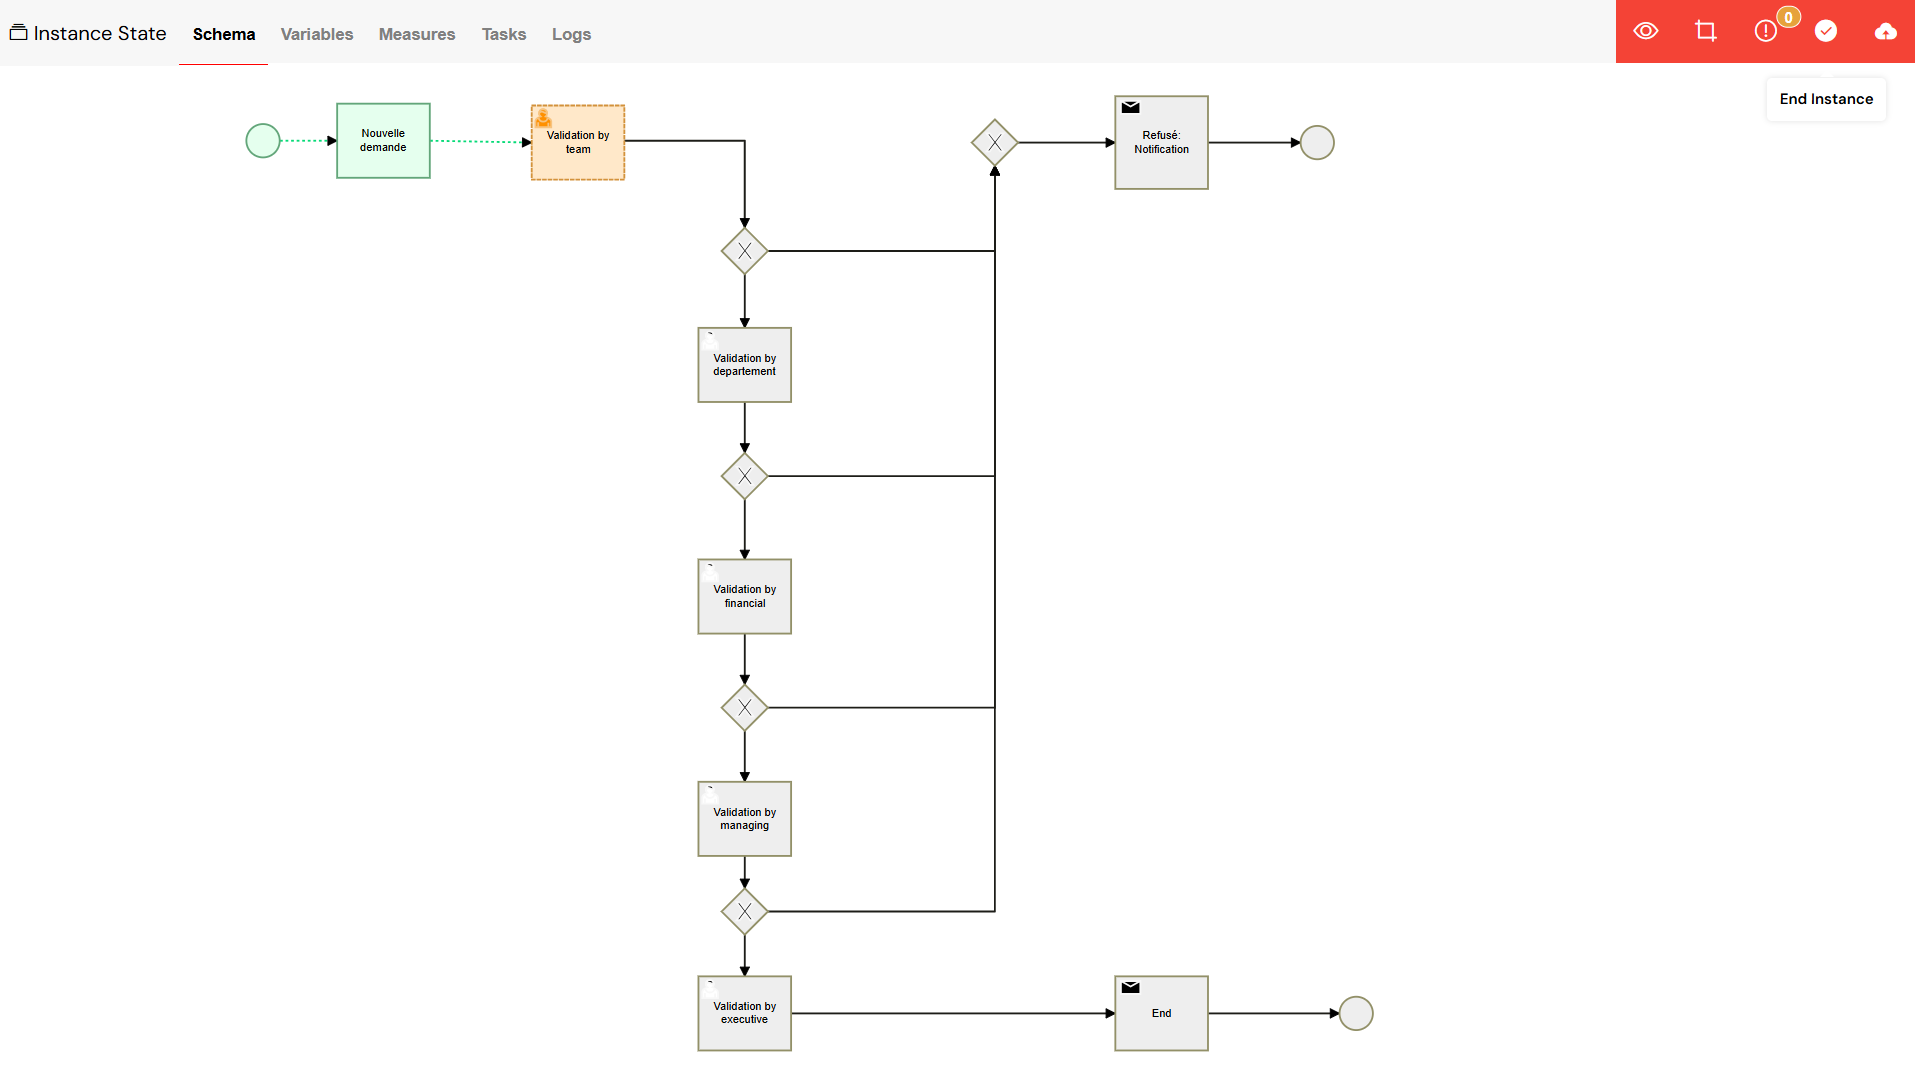
The Schema View offers a powerful visual representation of your process, allowing you to see exactly what's happening:
- Visual Process Flow: The BPMN diagram of your process is displayed, with the current status of each activity clearly indicated.
- Activity Highlighting: Running activities are highlighted in orange, completed activities in green, and any errors are marked in red, providing an immediate visual summary.
- Click Interactions: You can click on any activity in the diagram to open a detailed view with more information.
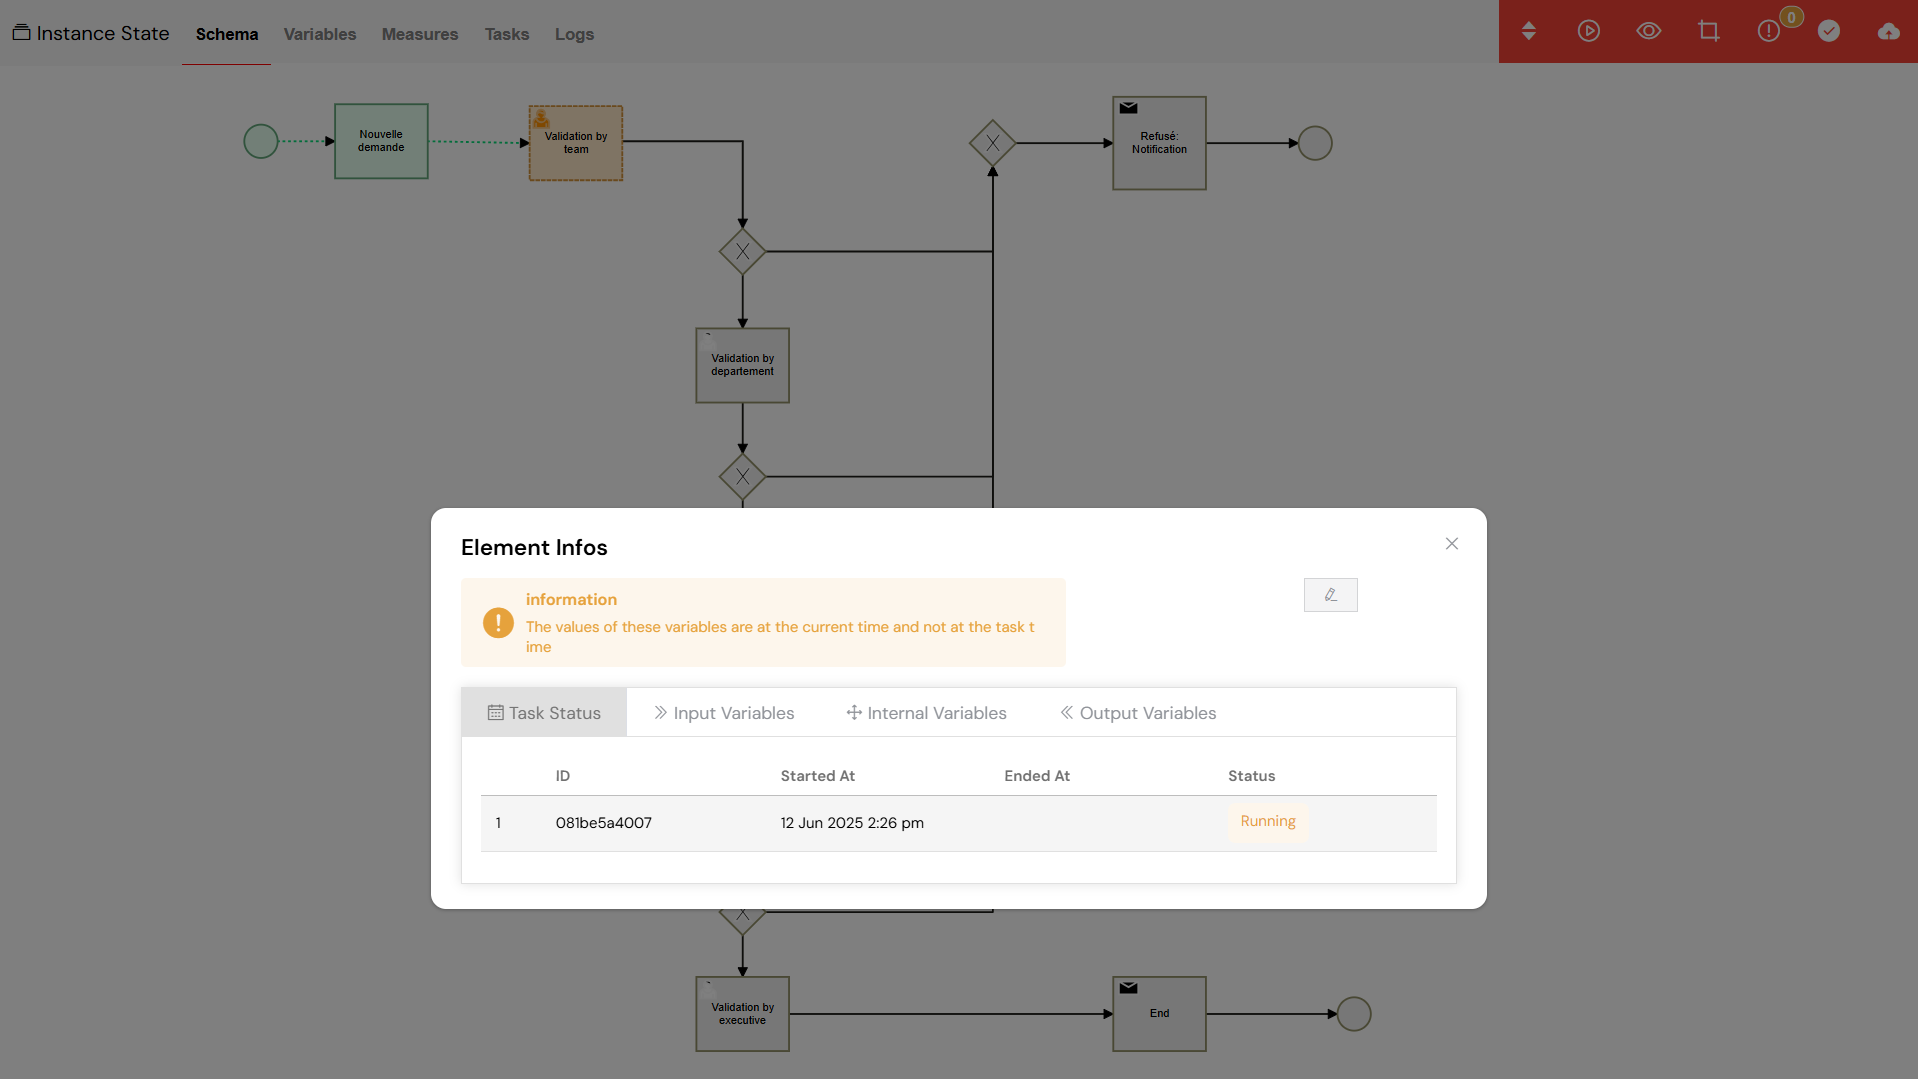
The Schema View provides a visual representation of the process flow with color-coded activity statuses.
8.2. The Variables View
The Variables View allows you to inspect and manipulate the data associated with a process instance:
- Instance Variables: You can view and edit all the variables for a given process instance.
- Variable Types: The view supports a wide range of variable types, including strings, numbers, dates, arrays, and objects.
- Add Variables: If needed, you can even create new variables while the process is executing.
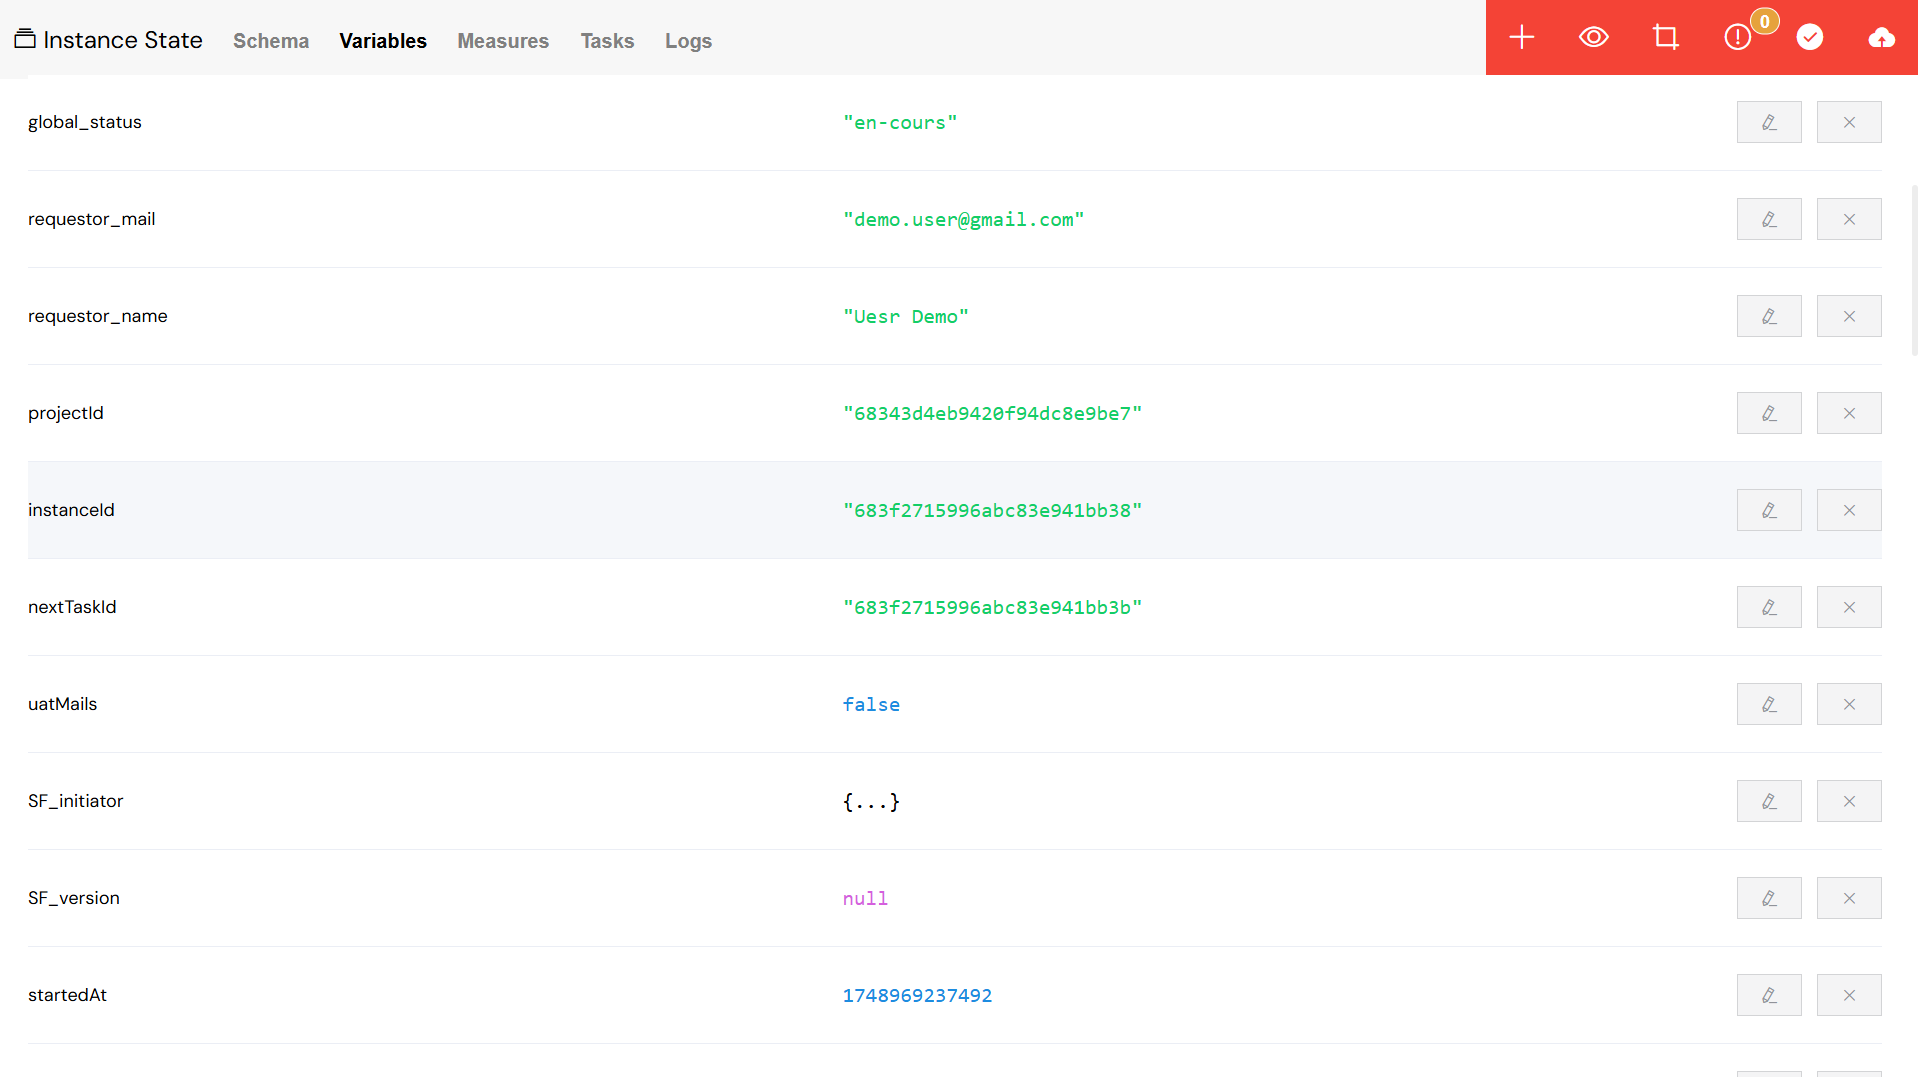
The Variables View allows for real-time inspection and editing of process data.
8.3. The Measures View
This view is dedicated to tracking the performance metrics you have defined for your process:
- Performance Metrics: Here you can view all the calculated measures for the instance.
- Add Measures: You can also create new performance indicators on the fly to track additional metrics.
- Edit Values: If necessary, you can manually edit the values of your measures.
 View](/img/02_developpement_guide/07-monitor-run/measures_view.png)
The Measures View helps you track key performance indicators for your processes.
8.4. The Tasks View
This view provides a focused look at all the tasks associated with a particular instance:
- Task List: A comprehensive list of all tasks for the instance is displayed.
- Task Details: For each task , you can see its creation date, status, and current assignments.
- Task Actions: You have the ability to edit, view, or delete each individual task .
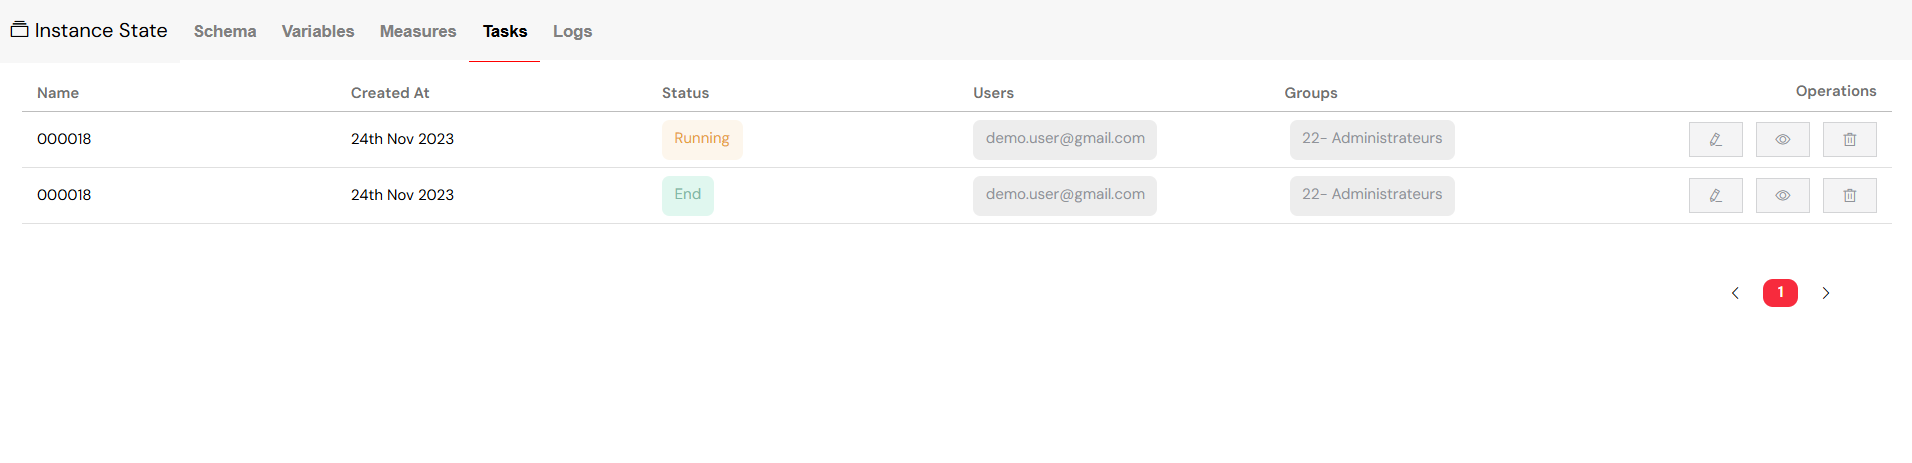
The Tasks View gives a detailed breakdown of all tasks within an instance.
8.5. The Logs View
The Logs View provides a complete audit trail of everything that has happened within an instance:
- Activity Logs: A detailed and chronological record of all instance activities is available for review.
- User Actions: You can track who performed which actions, providing full accountability.
- Search Logs: The logs are fully searchable, allowing you to filter by user, date, action type, or any other details.
- Export Options: For more in-depth analysis, you can access detailed log information.
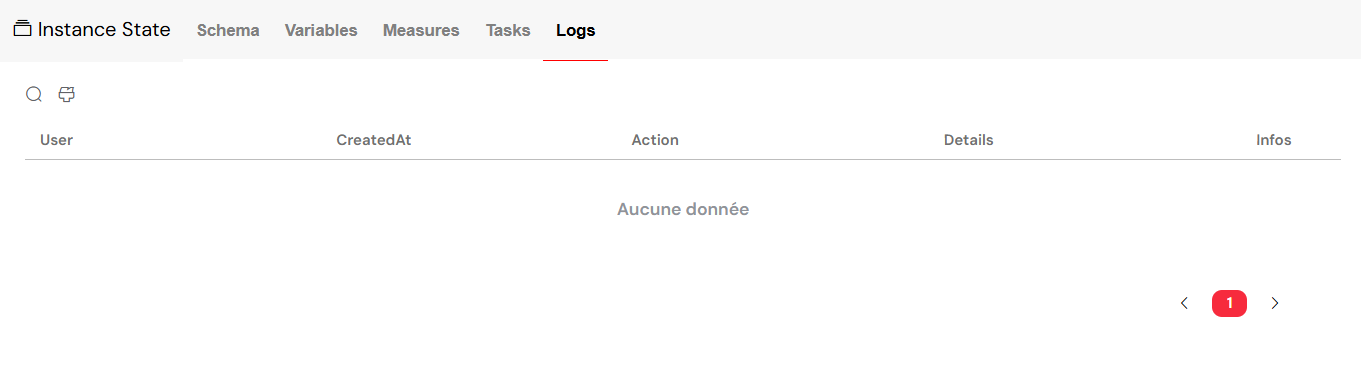
The Logs View provides a comprehensive audit trail for each instance.
8.6. The Sub-processes View
If your process includes sub-processes, this view allows you to manage them effectively:
- Child Instances: You can view all the related sub-process instances that have been initiated by the parent process.
- Navigation: It is easy to navigate from the parent process to any of its sub-process details.
- Status Tracking: You can monitor the completion status of each sub-process, ensuring the entire workflow is progressing as expected.

The Sub-processes View helps you track and manage child instances.
9. Best Practices for Effective Monitoring
9.1. Monitoring Strategies
- Regular Checks: Make it a habit to monitor the dashboard regularly to catch any potential errors before they escalate.
- Set Up Notifications: Configure error notifications to ensure you are proactively informed of any issues that require your attention.
- Use Filters: Master the use of filtering to efficiently focus on specific processes or troubleshoot issues without unnecessary noise.
9.2. Task Management Guidelines
- Clear Assignments: Ensure that every task is clearly and properly assigned to the appropriate users or groups to avoid confusion.
- Monitor Workload: Keep an eye on the distribution of tasks across your team members to ensure a balanced workload.
- Update Assignments: As team availability changes, be sure to update task assignments accordingly to maintain operational efficiency.
9.3. Error Handling Procedures
- Quick Response: Address any errors promptly to prevent them from causing significant process delays or downstream issues.
- Root Cause Analysis: Utilize the detailed logs to conduct a thorough root cause analysis for any errors that occur.
- Process Improvement: Use the insights gained from error patterns to make continuous improvements to your processes.
9.4. Performance Considerations
- Environment Separation: Always use the appropriate environments (TEST/UAT/PROD) for each stage of your development and deployment lifecycle.
- Resource Monitoring: Keep track of the number of instances and overall system performance to anticipate and prevent resource bottlenecks.
- Cleanup: Regularly end and archive completed instances to maintain optimal system performance and a clean operational environment.
By providing the tools needed for smooth process execution and rapid issue resolution, the Monitor & Run page is an essential component for maintaining operational excellence in your Softyflow environment.
Next Steps
Now that you have a solid understanding of monitoring and runtime management, you are ready to explore more advanced topics:
- Reporting: Learn how to create insightful reports and dashboards from your process data.
- Integration: Discover how to monitor the performance of your external integrations and APIs.
- Database Integration: Find out how to monitor the performance of your database connections and queries.
- Test & Deploy: Learn how to optimize your deployment pipeline by leveraging insights from production monitoring.
For further exploration of administration and security, we recommend reviewing:
- User Management: A guide to managing user access and assignments.
- Role Management: Learn how to configure role-based permissions for granular control.
- System Logs: Dive deeper into advanced logging and creating audit trails.
- Authentication: Understand the security and access control mechanisms.
To optimize performance, explore our video tutorials and learn more about process measures for tracking Key Performance Indicators (KPIs).