Task & Instance Reports
1. Overview
In any business environment, understanding the performance and efficiency of your operations is key to success. Softyflow's Reports feature is a powerful analytics and monitoring tool designed to provide deep insights into your business processes. By tracking, analyzing, and visualizing data from every process execution, you gain the clarity needed to make informed decisions, identify bottlenecks, and drive continuous improvement.
Before you can harness the full potential of reporting, it is essential to have your project foundation in place. This includes setting up your project, designing your core processes, and understanding your application's database structure.
2. Report Types: A Comparative Look
Softyflow offers two primary types of reports, each tailored to a different aspect of process analysis. Understanding their distinct purposes is crucial for effective monitoring.
| Feature | Instance Reports | Task Reports |
|---|---|---|
| Primary Focus | End-to-end process lifecycle (an entire workflow run). | Individual human activities (User Tasks) within a process. |
| Key Insights | Overall process health, cycle times, and outcomes. | User workload, task efficiency, and step-level bottlenecks. |
| Typical Use Case | Tracking an entire order fulfillment from start to finish. | Analyzing how long it takes the support team to approve a request. |
| Granularity | High-level (one record per process instance). | Granular (one record per user task). |
2.1. Instance Reports
An Instance Report provides a macro-level view of your process executions. Each time a process is initiated, it generates a single "instance"—a complete record of that specific workflow from start to finish. These reports are instrumental for:
- Monitoring Process Performance: Track completion rates, durations, and status (e.g., running, completed, failed).
- Analyzing Outcomes: Gain insights into the results of your processes by examining the final data.
- Identifying Bottlenecks: Pinpoint stages where processes slow down or fail.
- Ensuring Compliance: Maintain a complete audit trail of all process activities.
2.2. Task Reports
A Task Report zooms in on the specific User Tasks that occur within your processes. These are the steps that require human intervention, such as approvals, data entry, or reviews. Task reports are essential for:
- Measuring Team Performance: Analyze task completion times and user-specific workloads.
- Optimizing Workflows: Identify which tasks are taking the longest and may require process redesign.
- Filtering by Process Step: Isolate tasks related to a specific screen or stage in your workflow.
- Managing Deadlines: Track tasks against their due dates to ensure timely completion.
3. Mastering Instance Reports
3.1. Creating an Instance Report
Creating a report is a straightforward process. Navigate to the Reports tab in your project and provide the necessary information to get started.

Required Details:
- Report Name: Assign a clear and descriptive name (e.g., "Monthly Order Fulfillment Report").
- Process: Select the process you want to monitor from the dropdown list.
Upon creation, the system assigns a unique Instance Report ID. This ID is crucial for referencing the report in other parts of your application, such as displaying it in a web interface. To retrieve the ID, click the three-dots menu next to the report name and select the link icon.
3.2. Configuring Your Instance Report
Once created, you must configure the report to display the exact data you need. The configuration screen is split into two main sections: settings on the left and a live data preview on the right, which updates as you make changes.
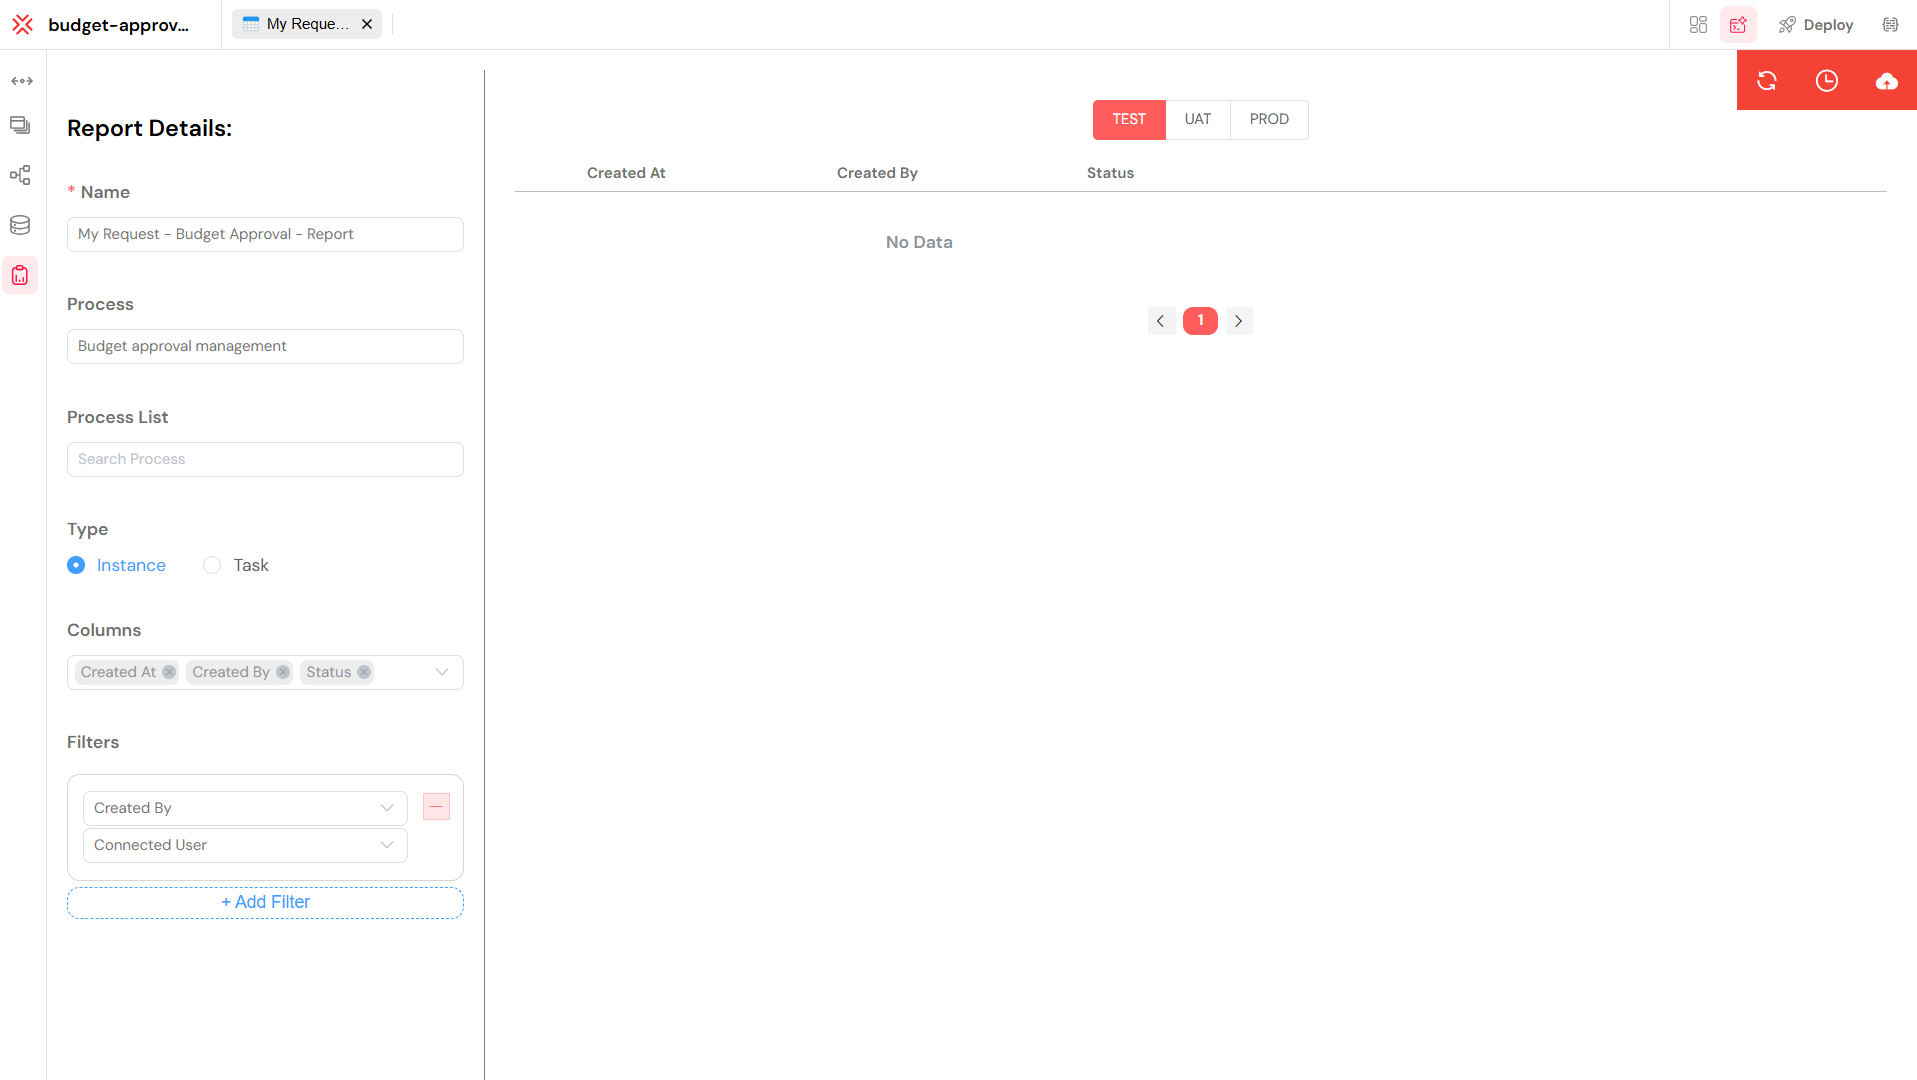
Report Configuration Options
Core Settings:
- Name: Rename your report at any time.
- Process: Change the associated process if needed.
- Type: Seamlessly switch between an Instance and Task report type.
Data Configuration:
- Columns: This is where you select the data to display. The available columns are derived from the Measures you have defined in your process. Choose the measures that are most relevant to your analysis.
- Filters: Define conditions to narrow down the results. For example, you could filter to show only instances that are "Completed" or those that were initiated within a specific date range.
- Sort: Set a default sorting order for your report, such as by "Start Date" in descending order.
Instance Measures
Instance reports automatically include a set of core process measures, providing a foundational layer of data for every report:
- Instance ID: The unique identifier for the process run.
- Process Name: The name of the associated process.
- Start/End Dates: The complete timeline of the execution.
- Status: The current state of the instance (e.g., running, completed, failed).
- Duration: The total time taken for the instance to execute.
- Initiator: The user or system that started the process.
4. Diving into Task Reports
4.1. Creating a Task Report
The process for creating a Task Report is identical to creating an Instance Report. The key difference lies in how you will configure and use it.
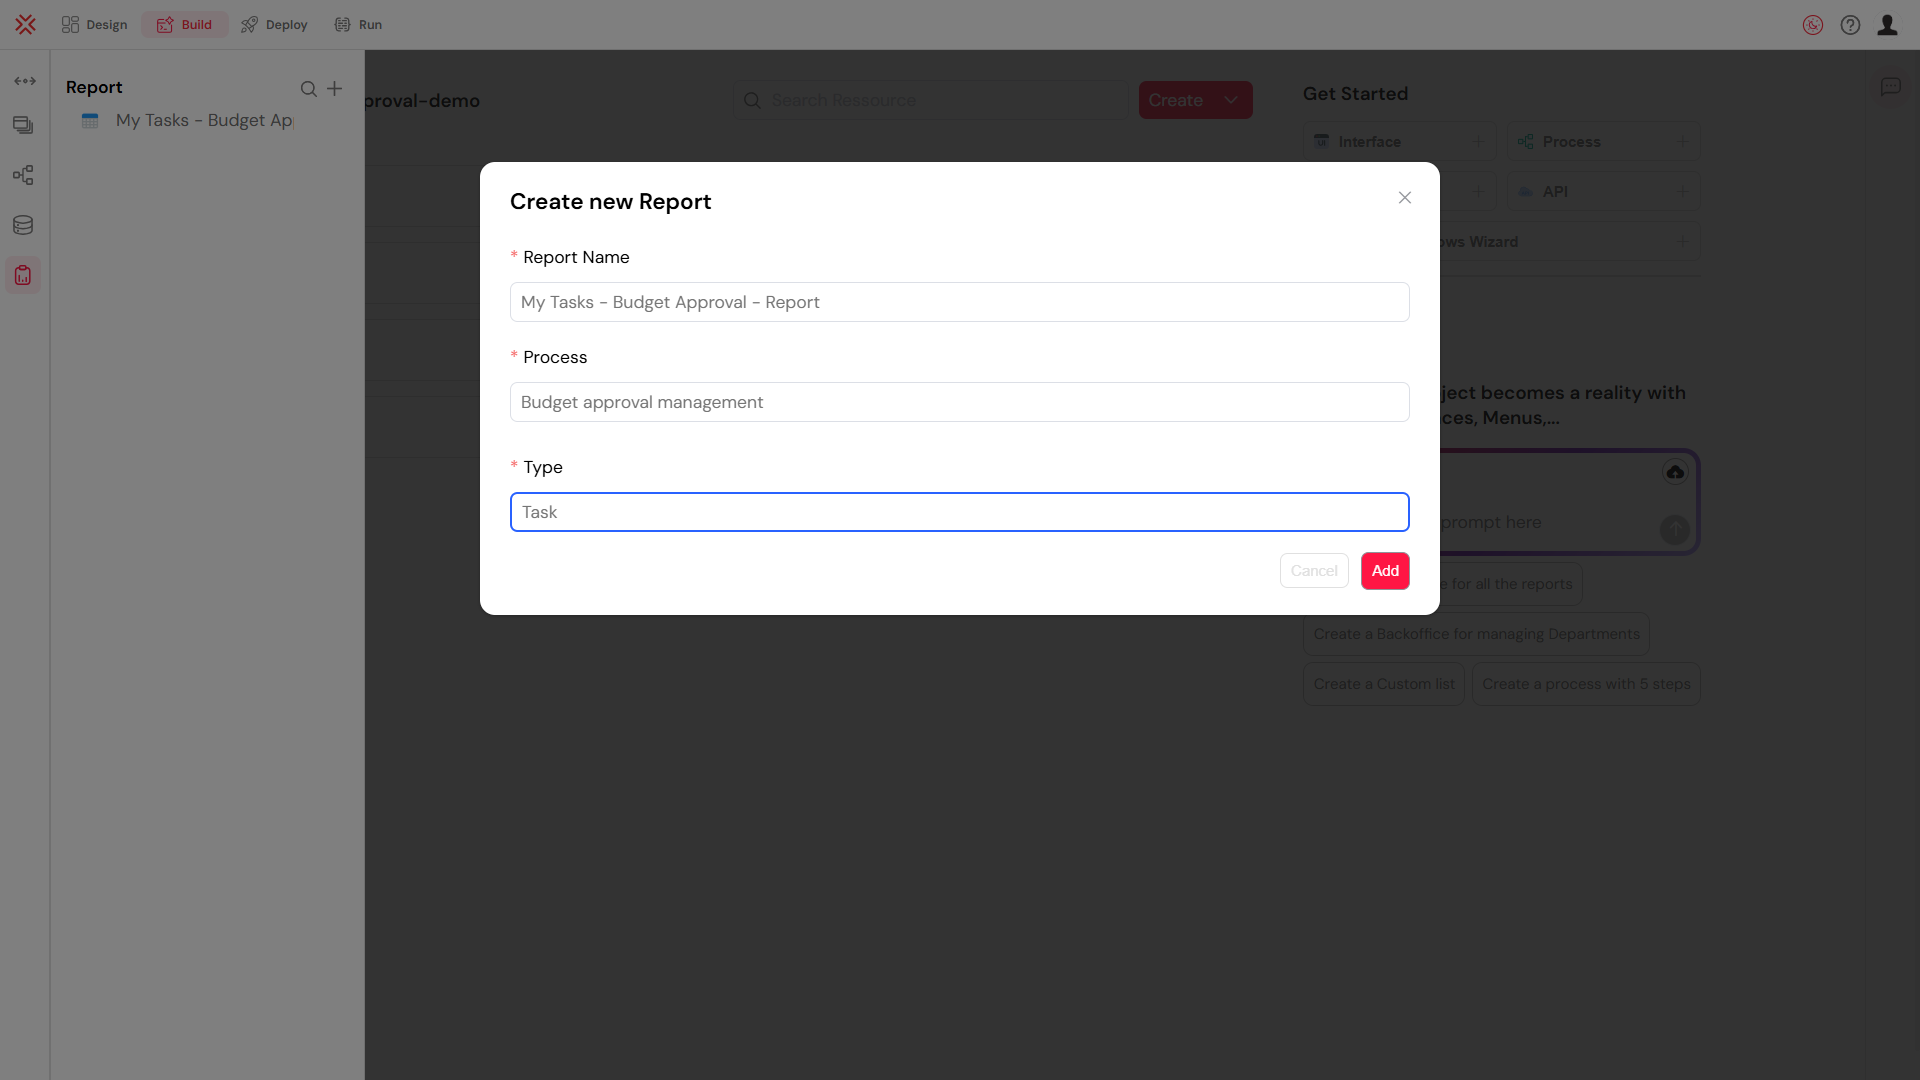
Required Details:
- Report Name: Give your report a meaningful name (e.g., "Manager Approval Performance").
- Process: Select the process that contains the user tasks you want to analyze.
Just like with instance reports, a unique Task Report ID is generated upon creation, allowing you to embed this report into your application's user interface.
4.2. Configuring Your Task Report
The configuration screen for Task Reports offers more specialized options tailored for analyzing user-driven activities.
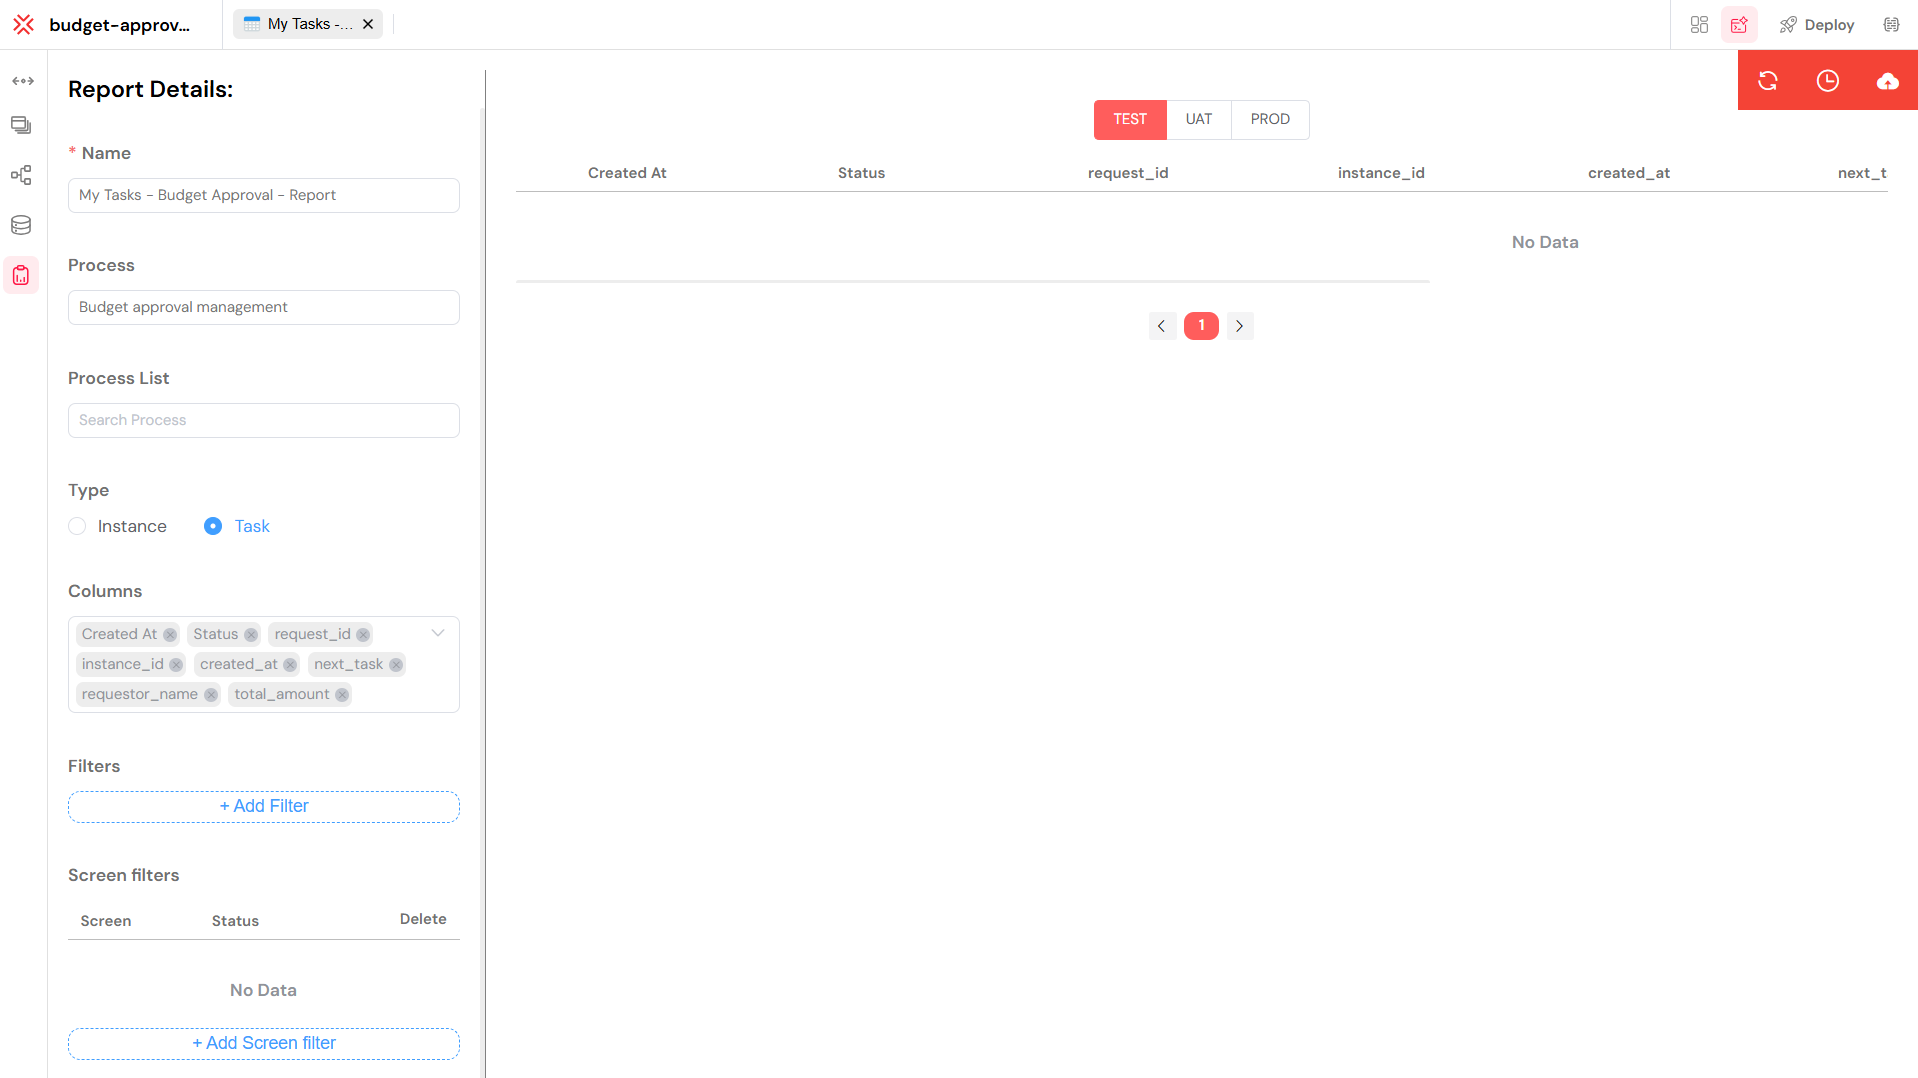
Report Configuration Options
Core Settings:
- Name, Process, and Type function identically to Instance Reports.
Data Configuration:
- Columns, Filters, and Sort are also configured similarly, drawing from the process Measures.
Task Report Specifics:
- Screen Filters: This powerful feature allows you to filter tasks based on the specific process step or screen they belong to. For example, you can create a report that shows only "Validation" tasks.
- State Filters: Further refine your report by task status, such as viewing only "Completed" or "Overdue" tasks.
Task Measures
Task reports automatically include key measures related to user tasks, giving you immediate visibility into workforce performance:
- Task ID: The unique identifier for the task.
- Task Name: The human-readable name of the task.
- Assignee: The user responsible for completing the task.
- Due Date: The deadline for the task.
- Completion Date: The timestamp when the task was finished.
- Screen: The process step or screen associated with the task.
- Priority: The importance level of the task.
- Status: The current state of the task (e.g., new, in progress, completed).
5. Visualizing Reports with Interactive Tables
The true power of Softyflow reports is realized when you display them in your application's web interfaces. The Table widget is the primary tool for this, transforming raw report data into a dynamic and user-friendly experience.
5.1. Key Table Widget Features
- Interactive Filtering: Allow users to perform real-time data filtering directly in the interface.
- Dynamic Sorting: Enable click-to-sort functionality on any column.
- Efficient Pagination: Handle large datasets with ease, ensuring fast load times.
- Data Export: Provide one-click export to CSV and Excel for offline analysis.
5.2. Advanced Table Capabilities
Column Types for Rich Display
- String: For textual data like names, statuses, and descriptions.
- Date & Time: For timestamps, deadlines, and durations.
- Number & Currency: For performance metrics, counts, and financial data.
- Boolean: For displaying true/false states like approval flags.
Interactive User Experience
- Real-time Filtering: Let users filter by date ranges, status, or assigned users on the fly.
- Multi-column Sorting: Allow users to organize data by multiple criteria simultaneously (e.g., sort by priority, then by due date).
- Row Selection: Enable users to select multiple tasks or instances to perform bulk actions.
Responsive and Modern Design
- Mobile-First: The table widget is optimized for touch controls and smaller screens.
- Adaptive Layout: Columns automatically adjust to fit the available screen space, ensuring readability on any device.
6. Security and Access Control
Security is paramount, and reports in Softyflow are designed to respect your organization's data governance policies. Access to report data is seamlessly integrated with the platform's security model.
- Role-Based Access: Users can only view data from reports they are authorized to see, as defined by their assigned roles in Role Management.
- Process-Level Permissions: Reports automatically inherit the security settings of the underlying process.
- Automatic Data Filtering: The system automatically filters the rows within a report to ensure users only see the instances or tasks relevant to them.
- Audit Trails: All access and modifications to reports are recorded in the system logs, providing a complete audit trail.
7. Best Practices for Effective Reporting
7.1. Report Design
- Use Clear Naming Conventions: Name reports descriptively (e.g., "Q3 Sales Approval Times" instead of "Report 1").
- Select Relevant Columns: Avoid clutter. Only include the data points that are essential for the report's purpose.
- Think About Performance: For very large datasets, create more specific reports with pre-defined filters rather than a single, all-encompassing report.
7.2. Table Configuration
- Implement Smart Filtering: Provide users with useful and intuitive filter options for the most common use cases.
- Configure for Export: If the report is frequently exported, ensure the default columns and sorting are optimized for offline analysis.
- Prioritize User Experience: Design the table display with the end-user in mind, ensuring it is easy to read and interact with.
7.3. Query Optimization
- Filter on Indexed Fields: For optimal performance, apply filters to database fields that are indexed.
- Balance Data and Performance: Set reasonable default limits on the amount of data loaded initially to ensure a snappy user experience.
- Leverage Caching: Define an appropriate data refresh strategy based on how frequently the underlying data changes.
8. Troubleshooting Common Issues
8.1. Common Problems and Solutions
- No Data is Displaying:
- Cause: Incorrect permissions or overly restrictive filters.
- Solution: Verify that the user has the correct role and permissions for the process. Check the report's filter logic to ensure it is not unintentionally excluding all data.
- Report is Loading Slowly:
- Cause: The query is returning too much data.
- Solution: Add more specific filters in the report configuration. Increase the use of pagination by reducing the number of items per page in the table widget.
- A Column is Missing:
- Cause: The corresponding Measure has not been configured in the process.
- Solution: Navigate to the process designer, add the required measure, and then update the report to include the new column.
- Export Fails or is Formatted Incorrectly:
- Cause: Incompatible data types or formatting issues.
- Solution: Check the data types of your columns. Ensure that any custom data transformations are handled correctly before being sent to the table.
8.2. Debugging Tips
- Test Incrementally: Test your report configuration with simple filters first, then gradually add more complexity.
- Use Browser Developer Tools: Open the browser's developer console to inspect network requests and look for any error messages during data loading.
- Verify Permissions: Always double-check that the user roles and process permissions are configured correctly.