Reporting
1. What are Reports?
Reports in Softyflow are a powerful feature designed to provide deep insights into your business processes. They go beyond simple data logging by offering comprehensive analytics and monitoring capabilities. By tracking, analyzing, and visualizing data from your process executions, reports empower you to make informed decisions, identify performance bottlenecks, and understand the real-world outcomes of your workflows.
Effective reporting is built on a solid foundation. Before you can create meaningful reports, it is essential to have:
- A well-defined project structure.
- Clearly designed business processes.
2. Report Types
Softyflow offers two primary types of reports, each tailored to a specific analytical need: Instance Reports and Task Reports.
2.1. Instance Reports
Instance reports provide a high-level overview of your process executions. Each time a process is initiated, it generates a unique "instance"—a complete run of that workflow from start to finish. These reports are crucial for understanding the overall health and efficiency of your business operations.
Key use cases for instance reports include:
- Monitoring Performance: Track key metrics like process completion rates, average duration, and error frequencies.
- Status Tracking: Gain real-time visibility into the status of all running processes (e.g., active, completed, failed).
- Data Analysis: Analyze the data collected during each process to identify trends, patterns, and business outcomes.
- Bottleneck Identification: Pinpoint stages in your process where delays frequently occur, allowing you to optimize workflows.
2.2. Task Reports
Task reports offer a granular view, focusing specifically on the user tasks within your processes. These reports are invaluable for managing team workloads, evaluating employee performance, and ensuring that critical activities are completed on time.
Key use cases for task reports include:
- Performance Metrics: Analyze task completion times, identify overdue tasks, and measure user efficiency.
- Screen-Specific Filtering: Isolate and analyze tasks associated with a particular form or step in your process.
3. Creating Reports
Creating a report in Softyflow is a straightforward process that begins with basic setup and moves into detailed configuration.
3.1. Basic Setup
- Navigate to Reports: From your project dashboard, open the "Reports" section.
- Create New Report: Click the "Create New Report" button to open the configuration wizard.
- Initial Configuration: Fill in the essential details for your report:
- Report Name: Assign a clear and descriptive name (e.g., "Monthly Sales Approval Performance").
- Process: Select the business process you want to analyze.
- Type: Choose between an "Instance" or "Task" report based on your analytical goals.
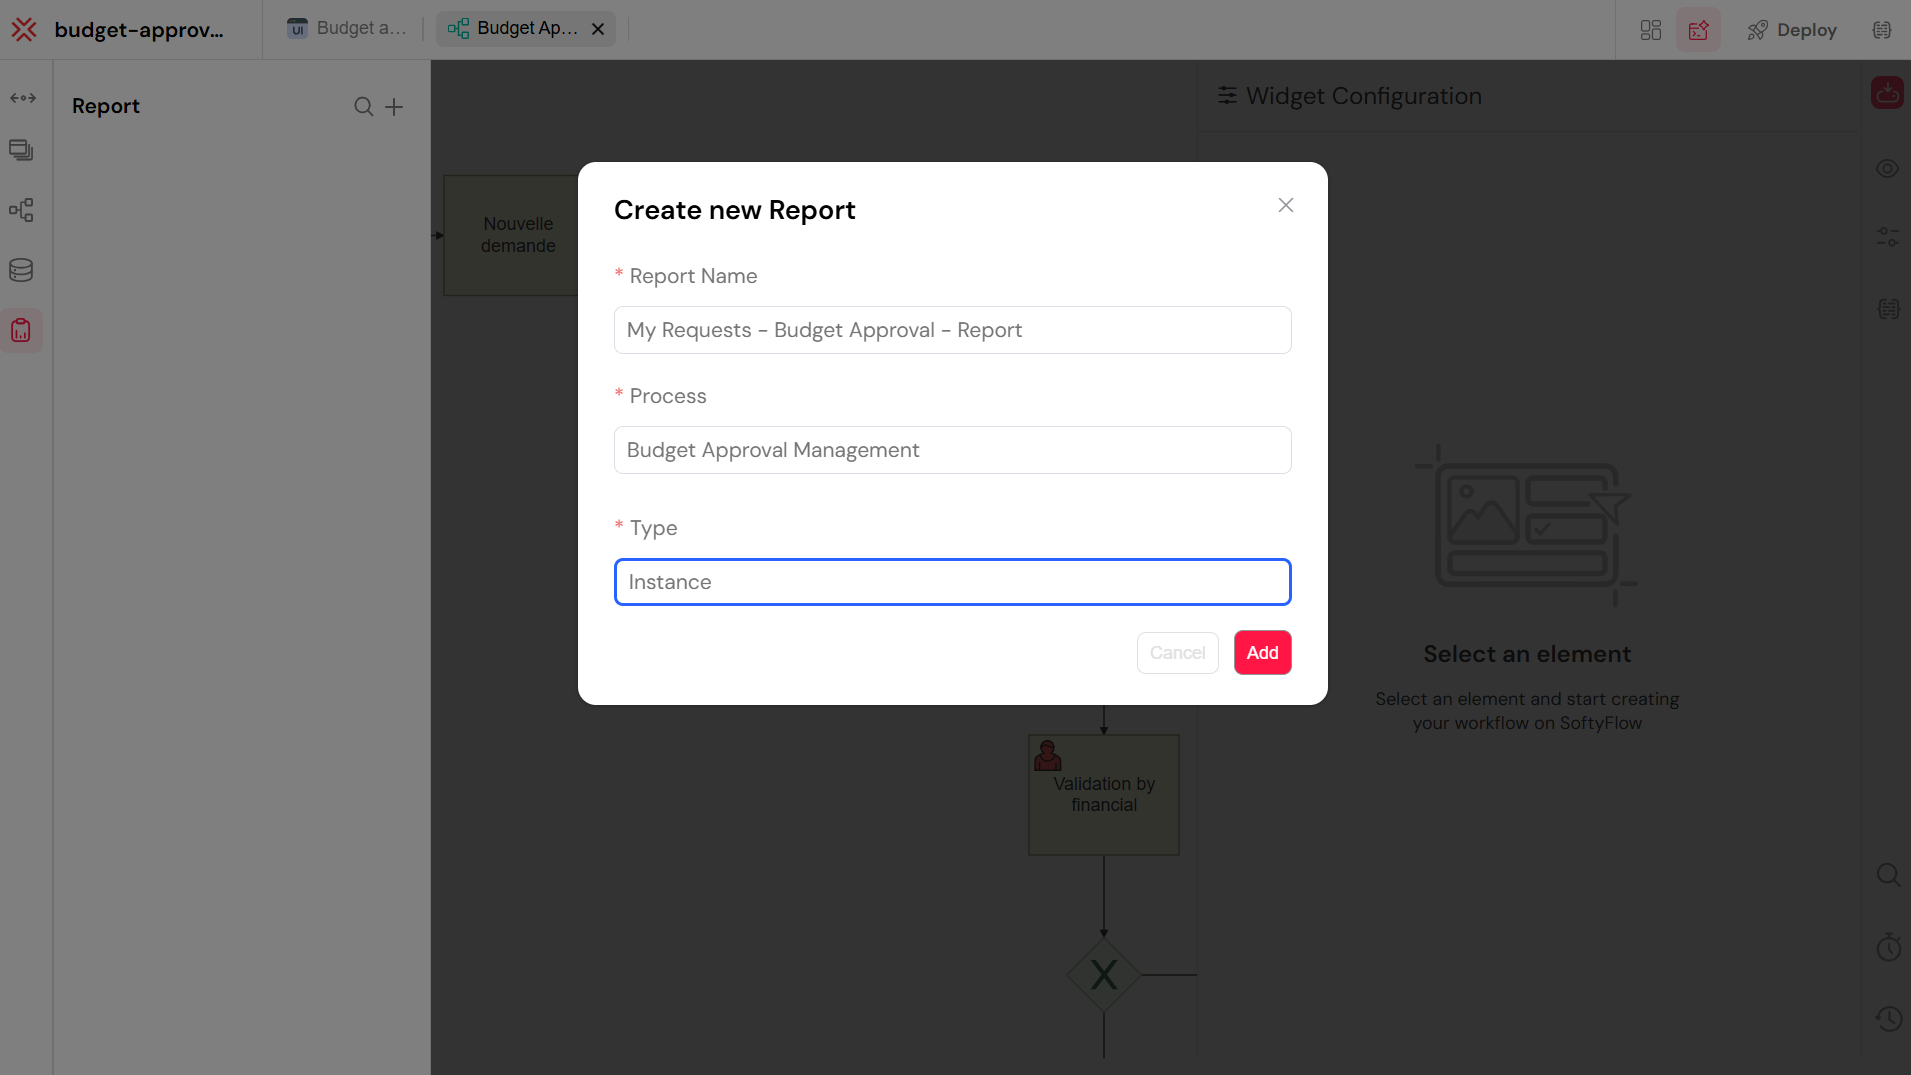
The initial report creation screen.
3.2. Report Configuration
After the initial setup, you can fine-tune your report using a variety of configuration options.
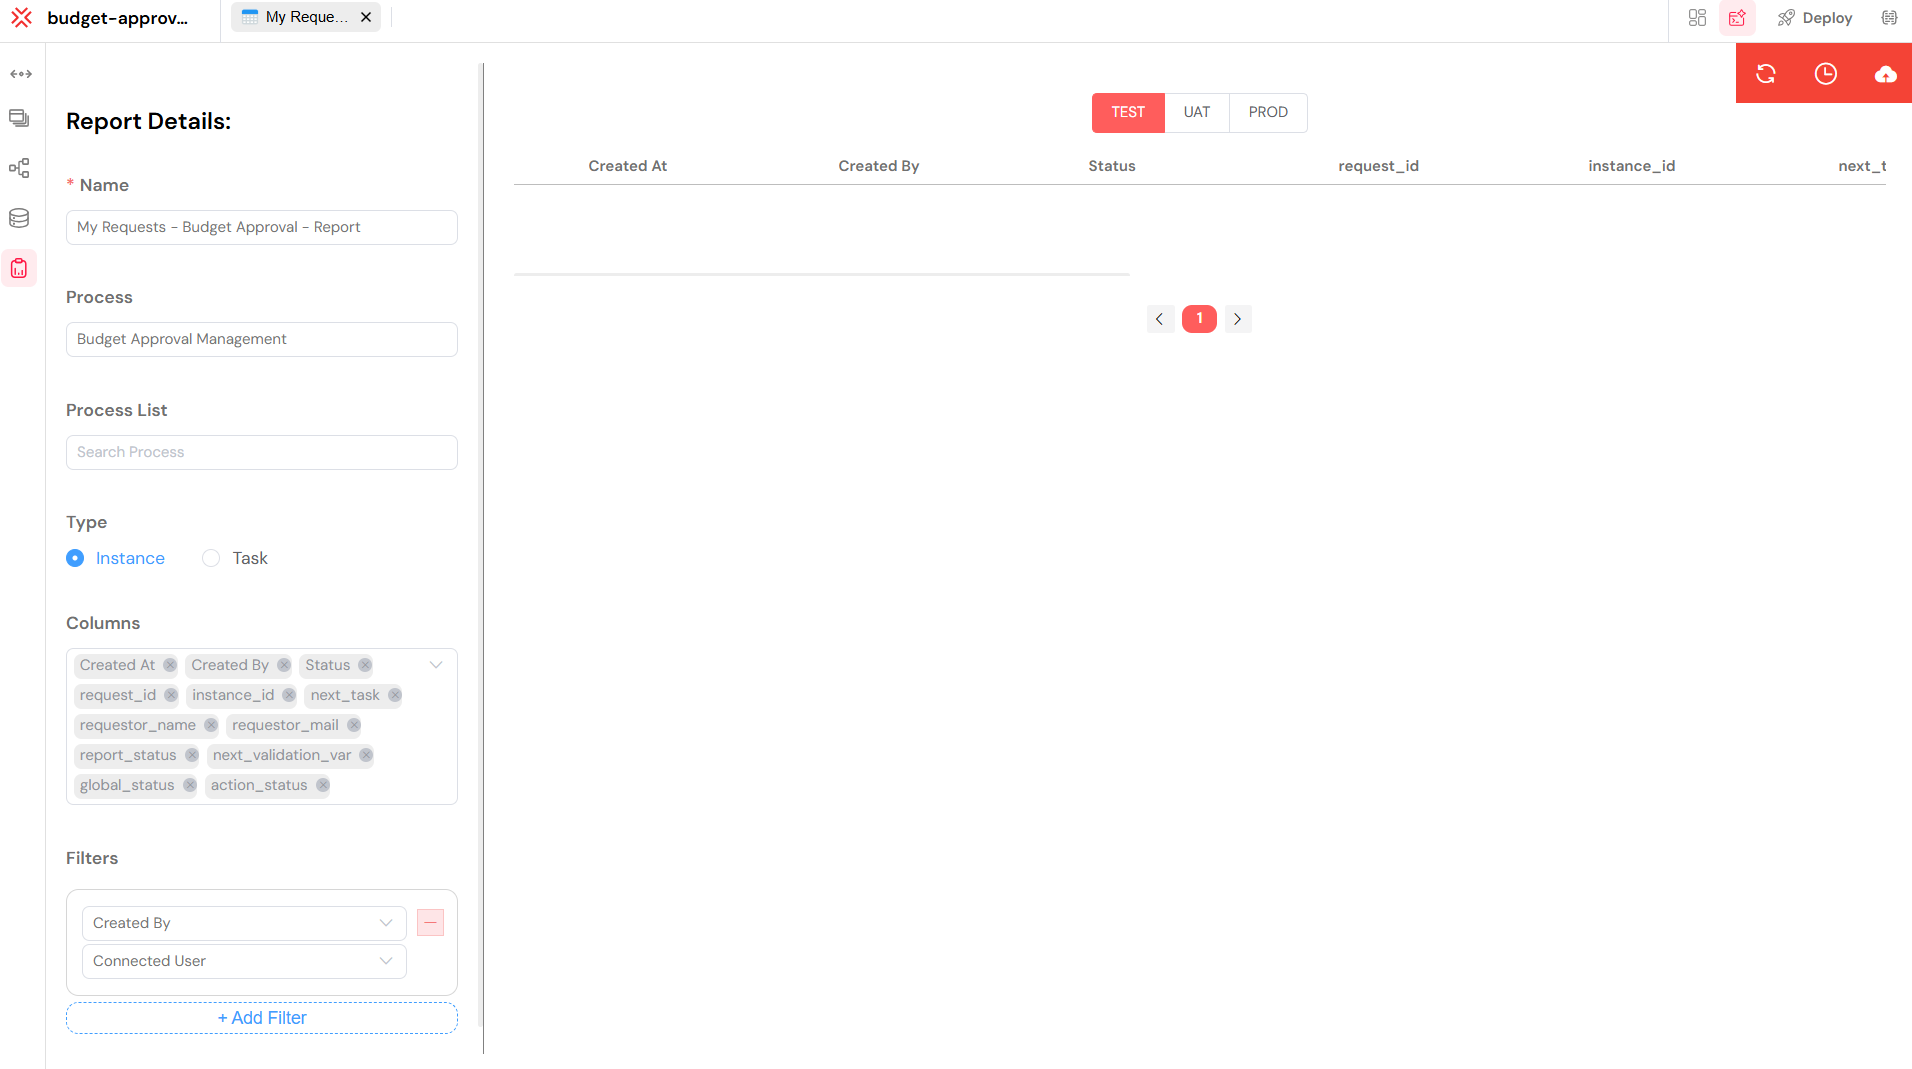
The main report configuration panel.
3.2.1. Core Settings
These settings define the fundamental properties of your report. You can modify them at any time.
- Name: Update the report name for clarity.
- Process: Change the process associated with the report.
- Type: Switch between "Instance" and "Task" views.
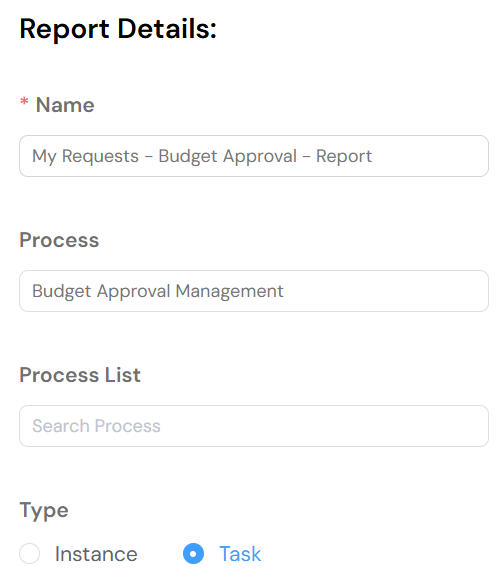
Core settings for a report.
3.2.2. Data Configuration
This section allows you to control the data presented in your report.
- Columns: Select which process measures (data fields) to display as columns.
- Filters: Define conditions to include or exclude specific data, allowing you to focus on what matters most.
- Sort: Set the default sorting order for your report (e.g., sort by creation date, descending).
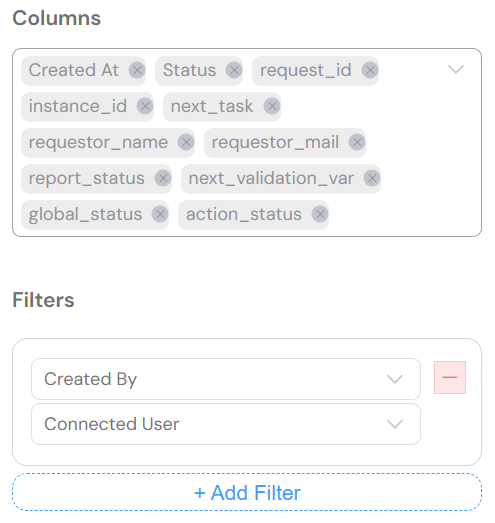
Data configuration options.
3.2.3. Task Report Specific Filters
For "Task" reports, you have additional filtering capabilities:
- Screen Filters: Narrow down the report to tasks associated with specific screens or steps in your process.
- State Filters: Filter tasks by their current status (e.g., "running," "completed" ).
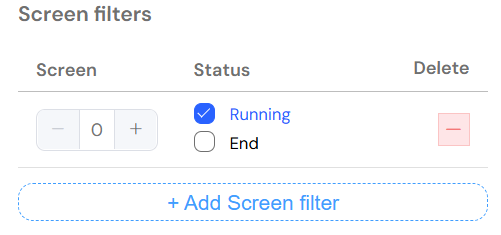
Task-specific filtering options.
4. Displaying Reports with Tables
The most effective way to visualize and interact with your reports is by using the Table widget in your web interfaces. This widget transforms raw report data into a dynamic and user-friendly table.
Key features include:
- Interactive Filtering: Allow users to apply filters in real-time to explore the data.
- Dynamic Sorting: Enable click-to-sort functionality on any column.
- Efficient Pagination: Automatically handle large datasets with easy-to-navigate pages.
- Data Export: Provide one-click export to CSV and Excel formats for offline analysis.
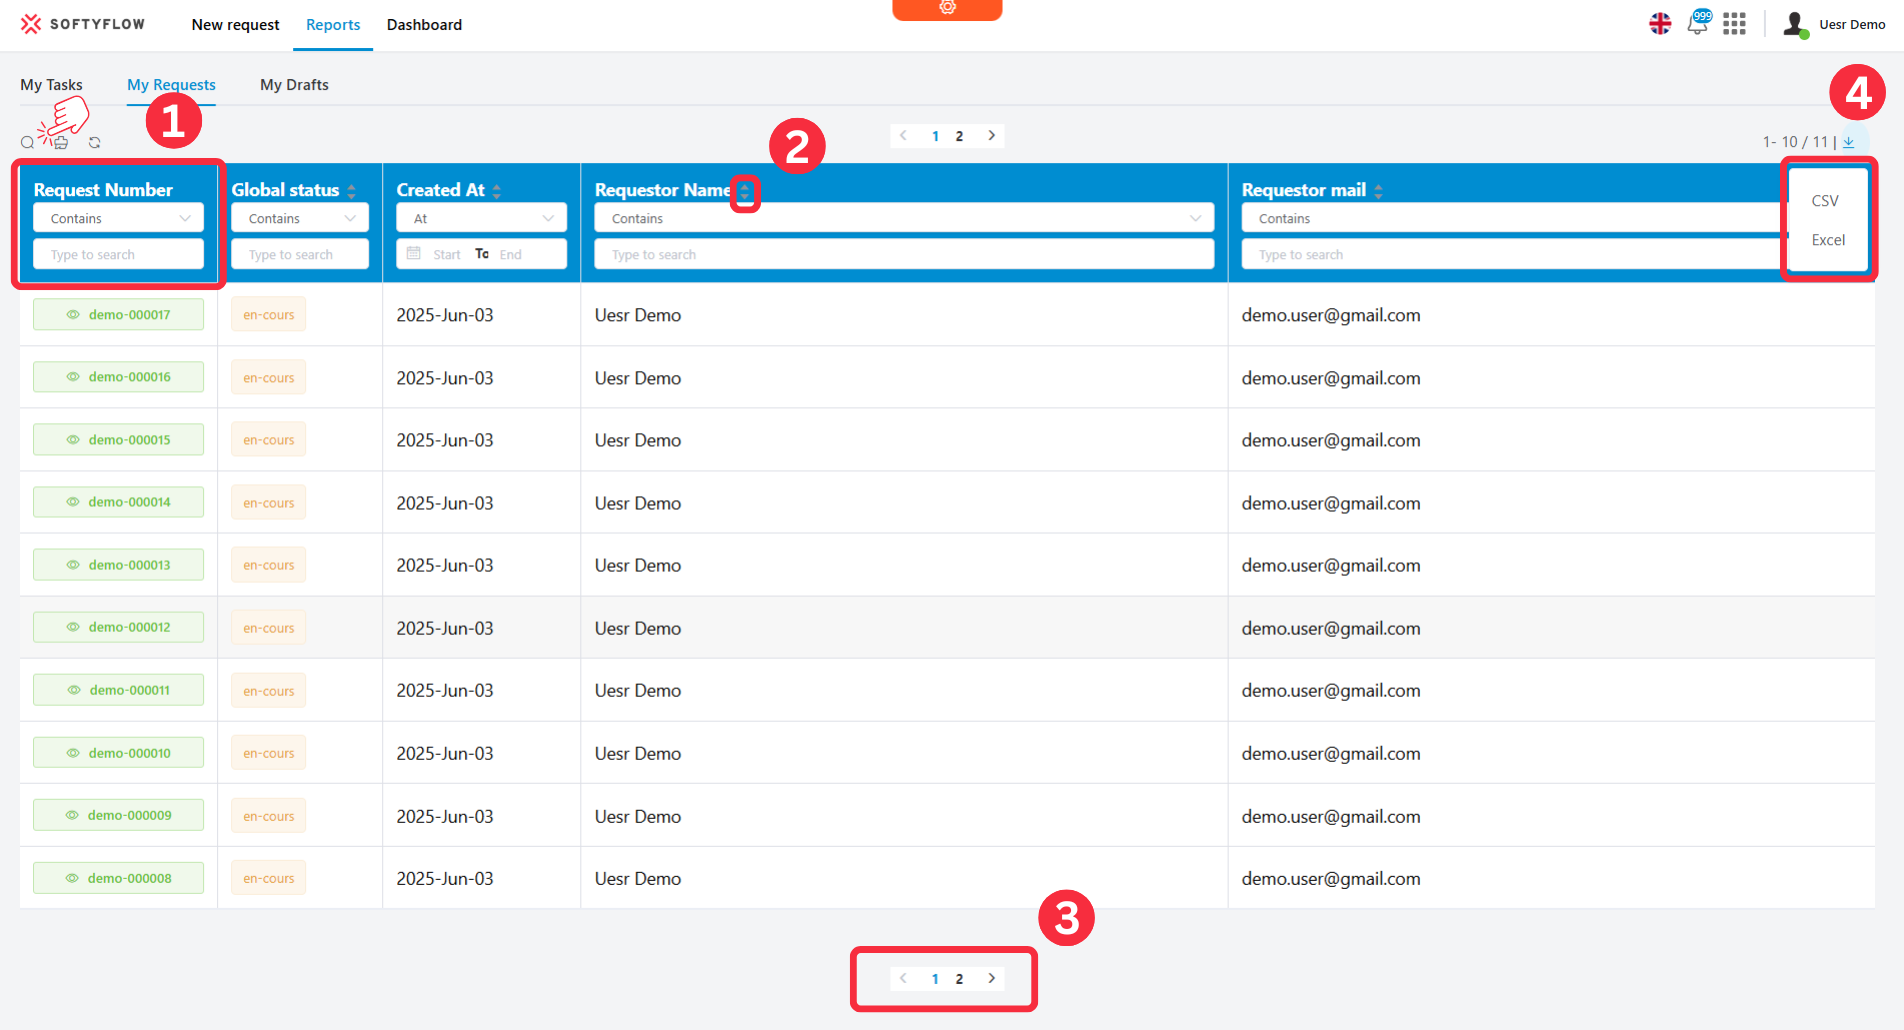
A report rendered as an interactive table.
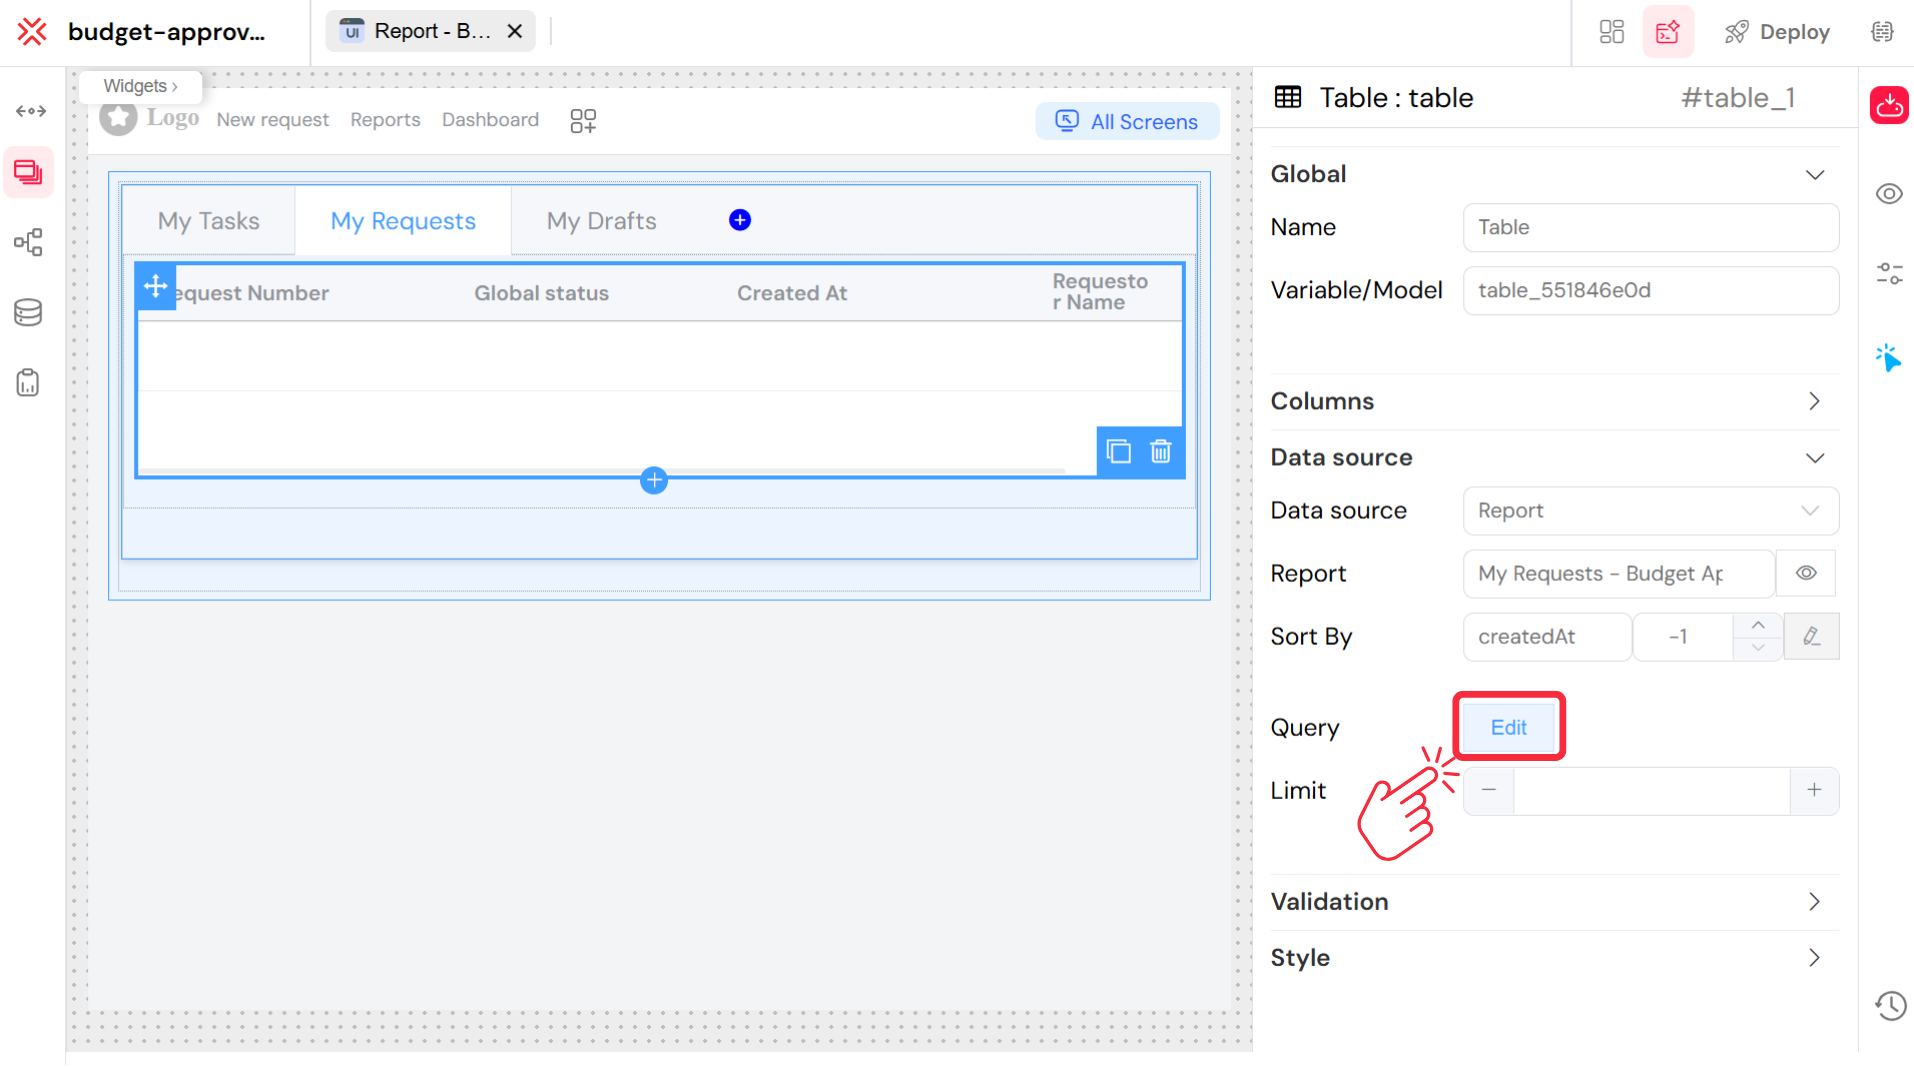
4.1. Data Source Configuration
To link a Table widget to your report, simply select "Report" as the data source and choose the desired report from the dropdown list. The table will automatically populate with the columns and data you configured.
4.2. Advanced Table Features for Reports
Leverage the full power of the Table widget to create a rich user experience.
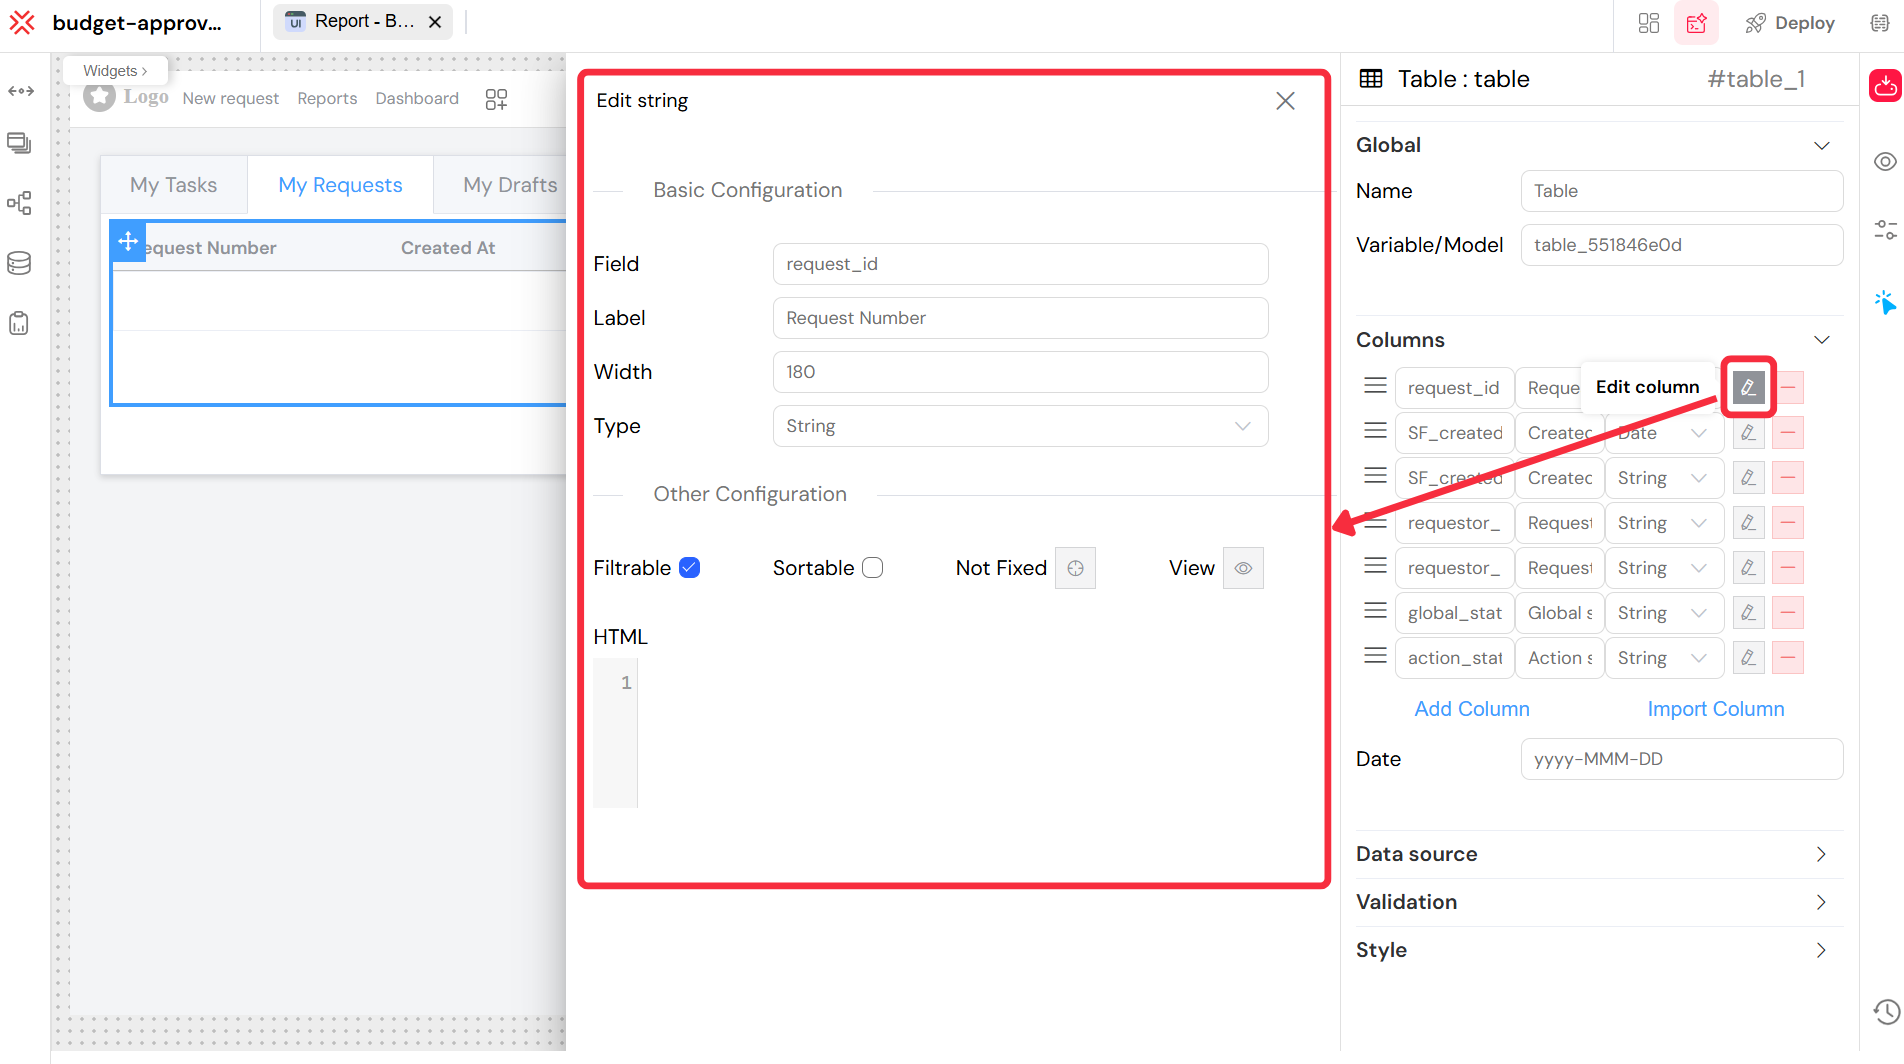
4.2.1. Column Types
Customize how data is displayed by setting the appropriate type for each column:
- String: For text-based data like process names, statuses, or descriptions.
- Date: For timestamps, deadlines, and completion dates, with proper formatting.
- Number: For numerical data such as durations, counts, or performance metrics.
- Currency: For financial data, ensuring correct formatting for cost analysis or budget tracking.
- Boolean: For true/false values, often displayed as checkboxes or status indicators.
4.2.2. Interactive Features
Enhance user interaction with these built-in capabilities:
- Real-time Filtering: Empower users to filter by date ranges, status, or assigned users on the fly.
- Multi-column Sorting: Allow users to organize data by multiple criteria simultaneously.
- Row Selection: Enable the selection of instances or tasks for bulk actions.
- Export Options: Let users generate custom reports in CSV or Excel format directly from the table.
4.2.3. Responsive Design
Tables are designed to be fully responsive and accessible on any device:
- Mobile Optimization: Includes touch-friendly controls for a seamless mobile experience.
- Collapsible Details: Configure rows to expand and show more detailed information.
- Adaptive Layout: Columns automatically adjust to fit different screen sizes.
Data Source Configuration.
5. Query and Filtering
Softyflow provides a flexible query engine to filter your report data, from simple conditions to complex aggregations.
The main interface for query and filter configuration.
5.1. Basic Filtering
Use simple expressions to create static filters for your report.
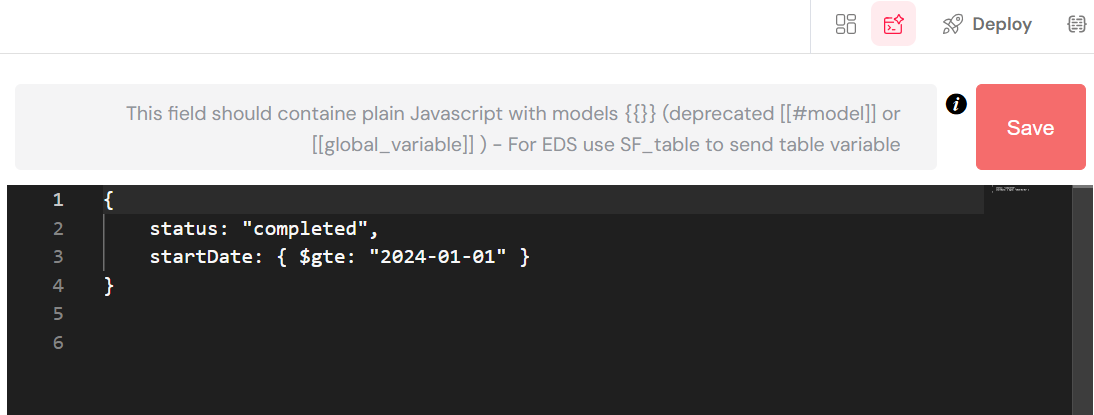
A basic filter to show only "completed" instances.
5.2. Dynamic Filtering
Create interactive reports by including variables in your filter conditions. These variables can be linked to input fields in your web interface, allowing users to filter the report dynamically.
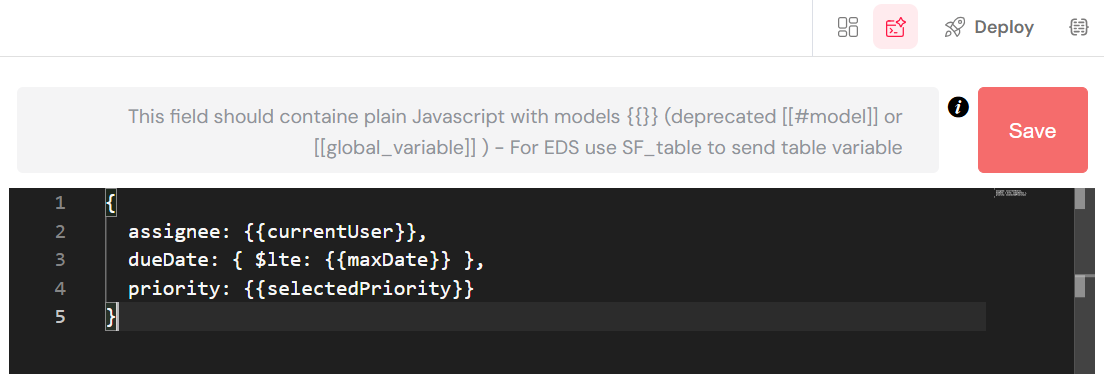
A dynamic filter using variables.
5.3. Advanced Queries
For more complex analytical needs, you can write aggregation queries to perform calculations on your data, such as counting instances or averaging durations.
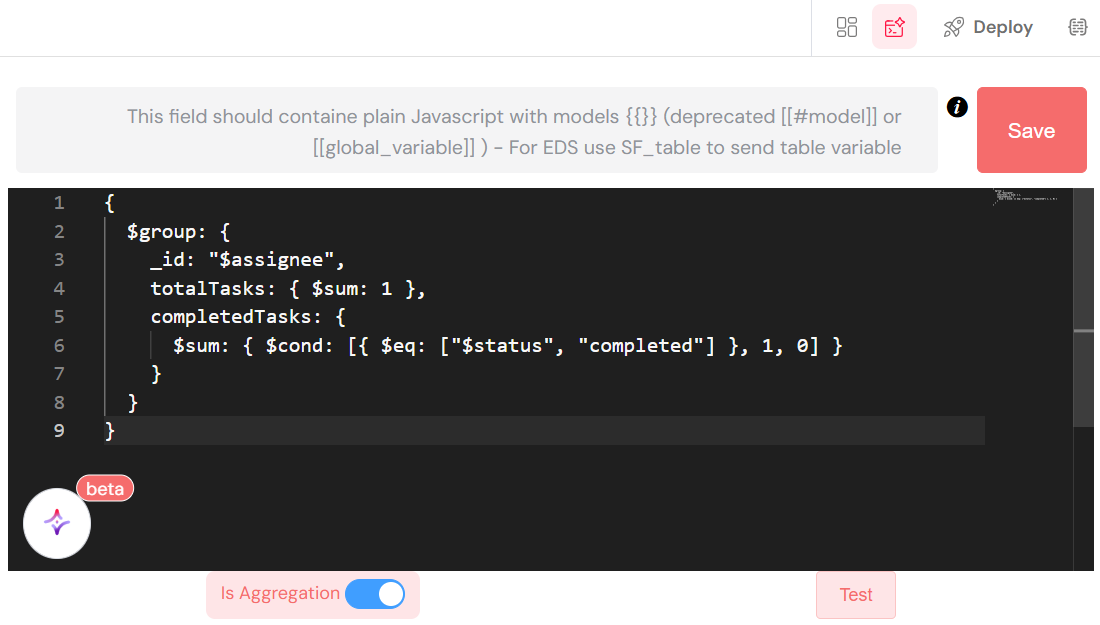
An advanced query to count instances grouped by status.
6. Process Measures
Reports are automatically populated with key data points, known as process measures, which are defined in your process design. These measures are the building blocks of your reports.
6.1. Instance Measures
Standard measures available for every process instance include:
- Instance ID: A unique identifier for each process run.
- Process Name: The name of the associated process.
- Start/End Dates: The exact timeline of the execution.
- Status: The current state of the instance (e.g., running, completed, failed).
- Duration: The total time taken for the execution.
- Initiator: The user who started the process.
6.2. Task Measures
Standard measures available for every user task include:
- Task ID: A unique identifier for each task.
- Task Name: The human-readable name of the task.
- Assignee: The user or group responsible for the task.
- Due Date: The deadline for task completion.
- Completion Date: The timestamp when the task was finished.
- Screen: The process step or form associated with the task.
- Priority: The importance level of the task.
7. Security and Access Control
Security is paramount in reporting. Softyflow's reporting engine is fully integrated with its robust security model, ensuring that users can only access data they are authorized to see.
- Role-Based Access: Report visibility and data access are controlled through role management.
- Process Permissions: Reports automatically inherit the security permissions of the underlying process.
- Data Filtering: The system automatically filters data based on the viewing user's context, preventing unauthorized data exposure.
- Audit Trail: All access and modifications to reports are logged in the system logs for full traceability.
8. Best Practices
To create effective and performant reports, follow these best practices.
8.1. Report Design
- Use Clear Naming Conventions: Give your reports descriptive names that clearly indicate their purpose.
- Include Only Relevant Data: Avoid clutter by selecting only the columns necessary to achieve your analytical goal.
- Group Logically: Organize related measures together to improve readability.
- Optimize for Performance: For very large datasets, limit the default data scope to ensure fast load times.
8.2. Table Configuration
- Use Pagination: Always enable pagination for reports that may return large numbers of rows.
- Provide Smart Filters: Offer useful and intuitive filter options to your users.
- Configure for Export: Ensure your columns are configured correctly for clean and easy export.
- Ensure Mobile Friendliness: Test your reports on various devices to guarantee a responsive design.
8.3. Query Optimization
- Be Specific with Filters: Use targeted queries to minimize the amount of data loaded from the database.
- Filter on Indexed Fields: For better performance, apply filters to database fields that are indexed.
- Set Reasonable Limits: Balance the need for comprehensive data with performance considerations.
- Consider a Cache Strategy: Evaluate if caching can be used for data that does not need to be real-time.
9. Troubleshooting
If you encounter issues with your reports, here are some common problems and solutions.
9.1. Common Issues
- No Data is Displayed:
- Cause: Incorrect query syntax, insufficient permissions, or no data matching the filter conditions.
- Solution: Check your process permissions, verify your query syntax, and ensure there is data to be displayed.
- Slow Performance:
- Cause: The query is returning too much data, or the filters are not optimized.
- Solution: Reduce the query scope, add more specific filters, or apply filters to indexed fields.
- Missing Columns:
- Cause: The required measures are not configured in the process design.
- Solution: Navigate to the process design and ensure all necessary measures are defined and enabled.
- Export Problems:
- Cause: Incorrect data types or formatting issues.
- Solution: Check the column type configurations in your Table widget and ensure they match the data being displayed.
9.2. Debugging Tips
- Test Queries in Isolation: Before adding a complex query to a report, test it independently to ensure it works as expected.
- Use Browser Developer Tools: Inspect the network requests and console logs in your browser to identify data loading issues.
- Verify User Permissions: Log in as a test user to confirm that the security settings are being applied correctly.
- Check System Logs: Review the application logs for any error messages related to report generation.
Next Steps
With a solid understanding of reporting, you are ready to continue developing your Softyflow application. Here are some recommended next steps:
- Web Interface Design: Build the user interfaces where your reports will be displayed.
- Process Design: Refine your processes to generate the data you need for insightful reporting.
- Database Integration: Connect to various data sources to enrich your reports.
- Integration: Integrate with external systems to pull in additional data for your reports.
- Test & Deploy: Thoroughly test your reports across different environments before deployment.
- Monitor & Run: Actively monitor your processes and use reports to gain continuous insights.
For hands-on experience, we highly recommend our step-by-step tutorials or watching our dedicated process and reports video tutorials.
For a deeper dive into advanced reporting features, explore our detailed documentation on Reports, the Table widget, and Process Measures.