Usage
The Usage page gives administrators an overview of the activity of the workspace: how many process instances were created and in which status, which processes and projects are used the most, how many users sign in, and the current size of the workspace (users, roles, projects). Use it to follow the adoption of your applications, watch the share of instances in error, or compare Test, UAT and Production.
To open the Usage page: in the navigation dock of the IDE, open the Monitoring group and click Usage (keyboard shortcut: G then A), or go directly to /ide/usage. The page requires the Monitoring right (see IDE Rights). The View analytics button of Instance tracking opens it too.
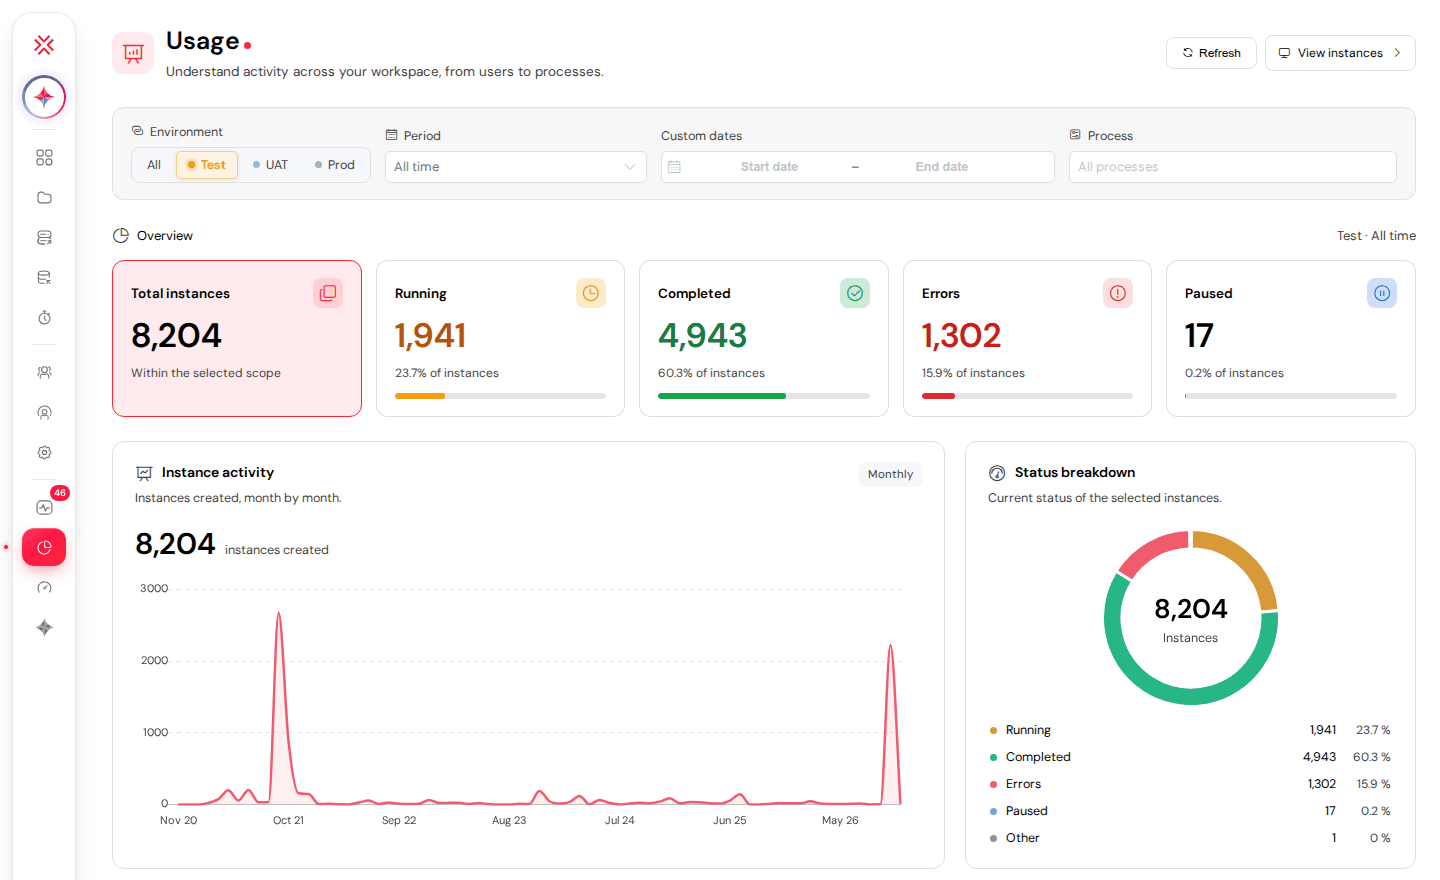
The header of the page holds two buttons:
- Refresh: reloads every figure of the page.
- View instances: opens Instance tracking, where you can open the instances themselves.
1. FiltersDirect link to 1. Filters
The filter bar under the header sets the scope of the figures:
- Environment: All, Test, UAT or Prod. The page opens on Test.
- Period: All time (default), Last 3 months, Last 6 months, Last 12 months or Last 2 years. The period is based on the creation date of the instances.
- Custom dates: a Start date – End date range, both days included. Choosing a period fills these dates; picking your own dates switches Period to Custom period.
- Process: type part of a name to find a process (all projects together). Clear the field to come back to All processes.
The current scope is recalled at the right of the Overview title, for example Test · All time.
Not every block uses every filter:
| Block | Environment | Period | Process |
|---|---|---|---|
| Overview, Instance activity, Status breakdown, Activity by process, Activity by project | Yes | Yes | Yes |
| Environments | No (always the three environments) | Yes | Yes |
| User activity | No | Yes | No |
| Your workspace | No | No | No |
2. OverviewDirect link to 2. Overview
The Overview row counts the instances of the selected scope:
- Total instances: every instance within the selected scope.
- Running, Completed, Errors and Paused: the number of instances in each status, their share of the total (for example 15.9% of instances) and a bar showing that share. The statuses are explained in Instance Lifecycle States.
3. Instance Activity and Status BreakdownDirect link to 3. Instance Activity and Status Breakdown
- Instance activity (Monthly): a curve of the instances created each month in the selected scope, with their total (instances created). Months without any instance are shown at 0.
- Status breakdown: a ring with the current status of the selected instances and, below it, each status with its number and percentage. Other groups the instances whose status is none of the four above.
4. Activity by Process and by ProjectDirect link to 4. Activity by Process and by Project
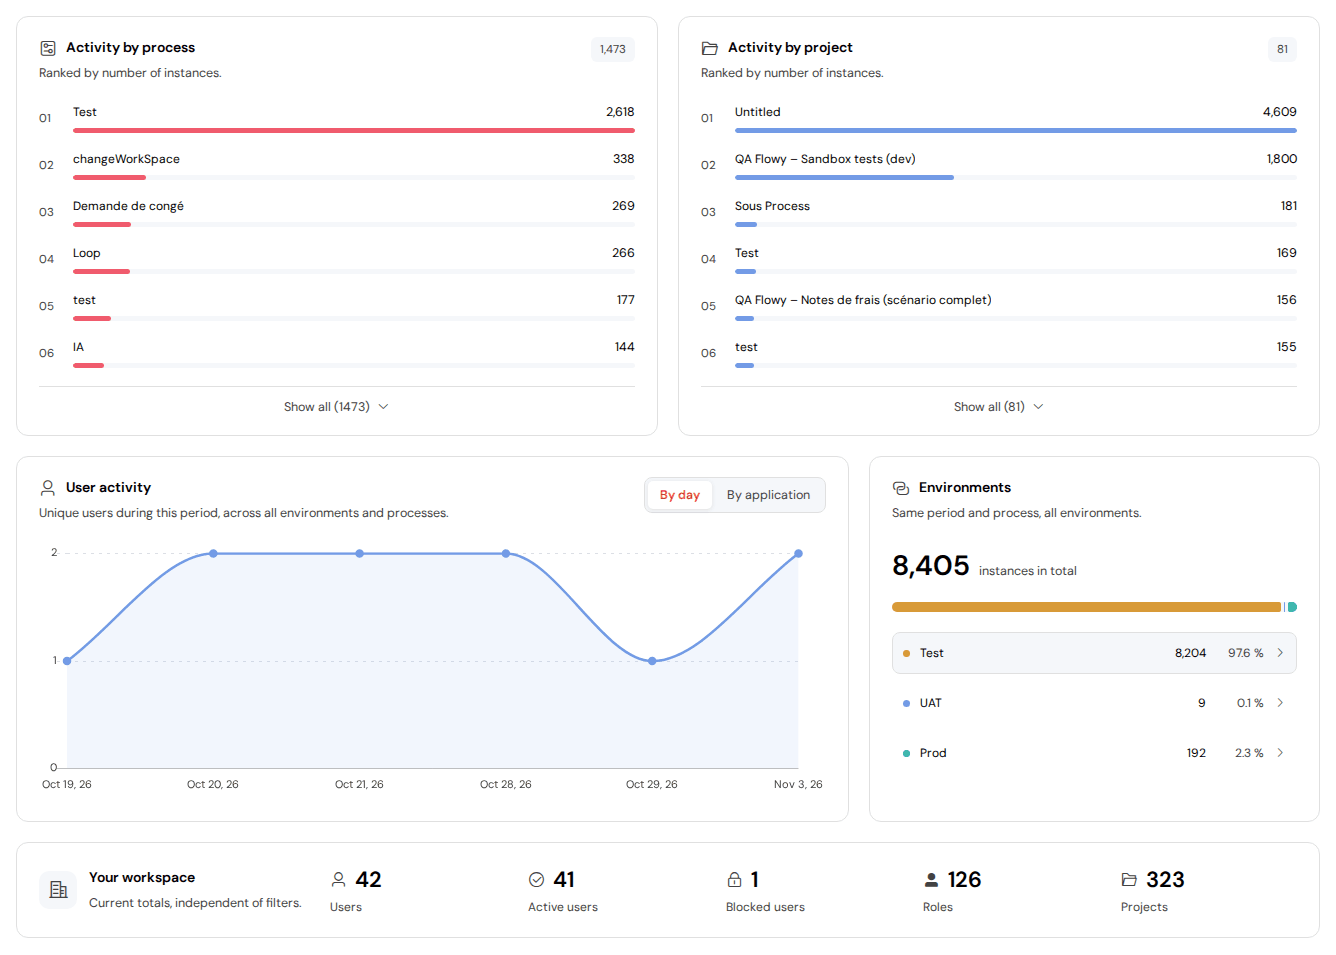
Activity by process and Activity by project rank the processes and the projects by number of instances in the selected scope. The rankings are made by name: processes (or projects) that bear the same name — for example two processes called Test in two different projects — are added together on a single row. The badge at the top right gives the number of different names found. The first six are shown; click Show all to see the full list and Show less to fold it. Untitled groups the instances whose process or project no longer exists or has no name.
5. User ActivityDirect link to 5. User Activity
User activity counts unique users, whatever the environment and the process. Two views are offered:
- By day: the number of different users who signed in each day of the period. Only the days with at least one sign-in appear.
- By application: for each project, the number of different users who opened at least one of its pages. As in the rankings above, projects that bear the same name share one row.
These figures come from the Sign in and Open interface events of the Activity log: this view uses the events still available in the log, so an old period can show No activity during this period.
6. EnvironmentsDirect link to 6. Environments
Environments compares Test, UAT and Production for the same period and the same process: the total number of instances (instances in total), a bar split by environment, then one row per environment with its number and percentage. Click a row to switch the Environment filter to that environment.
7. Your WorkspaceDirect link to 7. Your Workspace
Your workspace shows current totals, independent of the filters:
- Users: every user account (active and blocked), with Active users and Blocked users apart. See User Management.
- Roles: the number of roles.
- Projects: the number of projects.
8. When Figures Are MissingDirect link to 8. When Figures Are Missing
- No instances during this period: nothing matches the filters. Try another period or another environment.
- Some data could not be loaded.: one or more blocks show Data unavailable. Click Try again, or Refresh at the top of the page. The instance figures are computed with a short time limit: on a very large volume, narrow the period or choose a process.
Next StepsDirect link to Next Steps
- Instance tracking: open the instances behind the figures, find the errors and relaunch them.
- Logs: see who signed in and which pages were opened, event by event.
- User Management: manage the accounts counted in Your workspace and the Monitoring right.
- Role Management: review the roles of the workspace.