Measures
Measures are key performance indicators (KPIs) and data points that are calculated dynamically during process execution. They enable powerful reporting, analytics, and process monitoring capabilities by extracting and transforming business data from your process variables.
The process measures interface provides a visual overview of all configured KPIs and metrics, showing how workflow data is transformed into actionable business intelligence for monitoring and reporting purposes.
Overview
Process measures serve as the bridge between your workflow execution data and business intelligence. They allow you to:
- Track KPIs in real-time during process execution
- Generate reports with meaningful business metrics
- Monitor performance across process instances
- Analyze trends and patterns in your workflows
- Create dashboards with calculated business values
How Measures Work
Calculation Timing
Measures are calculated automatically at key points during process execution:
- Process Start: Initial calculation with starting variables
- Before User Tasks: Updated with current process state
- Task Completion: Recalculated after task completion
- Process Events: Updated during timer events, service calls, etc.
- Process End: Final calculation for completed instances
Data Storage
- Measures are stored in the process instance database
- Values are indexed for fast report queries
- Historical data is preserved for trend analysis
- Both current and historical values are available for reporting
Measure Configuration
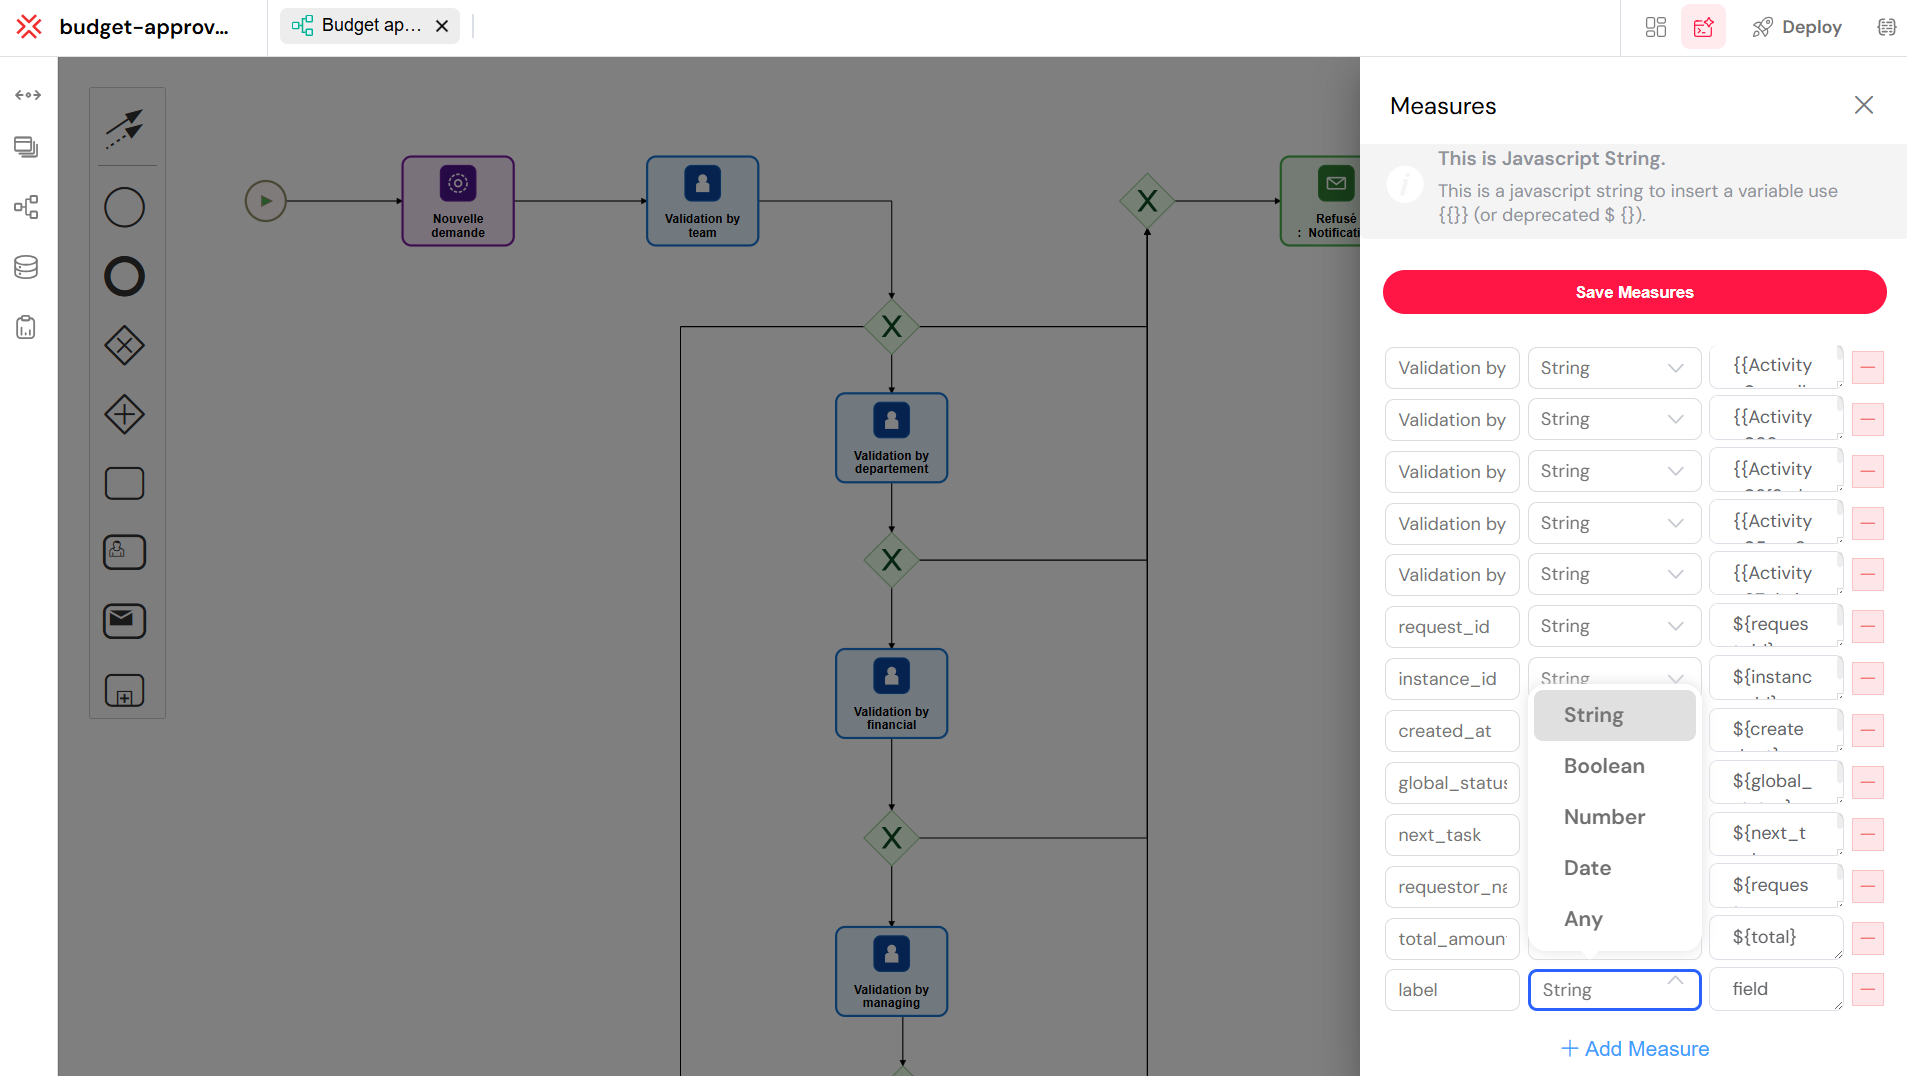
This configuration panel enables you to create custom business metrics by defining a descriptive label, selecting the appropriate data type, and writing JavaScript expressions that calculate values from your process variables.
Basic Properties
Each measure consists of three essential components:
1. Label
- Purpose: The name/identifier for the measure
- Usage: Used as column names in reports and dashboards
- Example:
TotalCost,ProcessingTime,CustomerSatisfaction - Best Practice: Use descriptive, consistent naming conventions
2. Type
Defines how the measure value should be processed and stored:
- String: Text values, categories, status descriptions
- Example:
"Approved","High Priority","Finance Department"
- Example:
- Number: Numeric calculations, counts, monetary values
- Example:
1250.50,45,0.95
- Example:
- Boolean: True/false flags, yes/no indicators
- Example:
true,false
- Example:
- Date: Timestamps, deadlines, milestones
- Example:
new Date(),"2024-12-31"
- Example:
- Any: Complex objects, arrays, or mixed data types
- Example:
{status: "active", items: [1,2,3]}
- Example:
3. Field (JavaScript Expression)
The JavaScript expression that calculates the measure value using process variables.
System Default Measures
Softyflow automatically provides several system measures for every process:
Process Tracking Measures
SF_last_activity_name: Name of the last executed activitySF_involved_users: Array of all users who participated in the processSF_involved_validators: Array of users who validated tasksSF_involved_roles: Array of roles that were assigned tasksSF_observer: Array of observer rolesSF_priority: Current process priority levelSF_description: Process description text
Instance Metadata (Available in Reports)
SF_status: Process instance status (running, completed, error)SF_name: Process instance nameSF_createdAt: Process start timestampSF_updatedAt: Last update timestampSF_createdBy: Process initiator information
Using Measures in Reports
This report configuration view demonstrates how process measures become available as report columns, enabling users to select, filter, sort, and visualize custom metrics alongside system-generated data for comprehensive analytics.
Report Column Configuration
Measures become available as columns in your reports. When configuring report columns:
- Custom Measures: All process measures appear as selectable columns
- System Measures: Built-in measures are automatically available
- Data Types: Column types match the measure type configuration
- Filtering: Measures can be used for report filtering and sorting
Best Practices
Measure Design
- Meaningful Names: Use descriptive labels that business users understand
- Consistent Naming: Follow naming conventions across all processes
- Appropriate Types: Choose the correct data type for each measure
- Performance Considerations: Avoid overly complex calculations
Expression Writing
- Error Handling: Use conditional logic to handle null/undefined values
- Type Safety: Ensure calculations match the expected data type
- Readability: Keep expressions clear and well-documented
- Testing: Test expressions with various data scenarios
Report Integration
- Column Selection: Include relevant measures for your analysis needs
- Filtering Strategy: Use measures for effective data filtering
- Aggregation Planning: Consider how measures will be grouped and summarized
- Performance Optimization: Be mindful of query complexity with many measures
Troubleshooting
Common Issues
Expression Errors
- Symptom: Measure shows empty value
- Cause: JavaScript expression error or undefined variable
- Solution: Check variable names and add null checks
// Problem: Variable might be undefined
{
  {
    customer.name;
  }
}

// Solution: Add null checking
{
  {
    customer ? customer.name : "Unknown";
  }
}
Type Mismatches
- Symptom: Unexpected values in reports
- Cause: Expression returns different type than configured
- Solution: Ensure expression result matches measure type
// Problem: String returned for Number type
{
  {
    status === "active" ? "Yes" : "No";
  }
}

// Solution: Return numeric value
{
  {
    status === "active" ? 1 : 0;
  }
}
Performance Issues
- Symptom: Slow report generation
- Cause: Complex measure calculations
- Solution: Simplify expressions or pre-calculate values
Debugging Tips
- Test Variables: Verify process variables contain expected data
- Simplify Expressions: Start with simple expressions and add complexity gradually
- Check Types: Ensure measure types match expression outputs
- Monitor Performance: Watch for calculation time in process logs
Process measures are powerful tools that transform your workflow data into actionable business intelligence. By properly configuring and utilizing measures, you can create comprehensive reporting solutions that provide deep insights into your business processes and their performance.