Reporting
1. What are Reports?
Reports in Softyflow provide comprehensive analytics and monitoring capabilities for your business processes. They allow you to track, analyze, and visualize data from process executions, giving you valuable insights into performance, bottlenecks, and outcomes.
Before creating reports, ensure you've set up your project, designed your processes, and understand your database structure.
2. Report Types
2.1. Instance Reports
Instance reports provide insights into process executions. Each time a process runs, it creates an instance - a unique occurrence of that workflow. Instance reports help you:
- Monitor process performance and completion rates
- Track instance status and timestamps
- Analyze process data and outcomes
- Identify patterns and bottlenecks
2.2. Task Reports
Task reports focus on user tasks within processes. They provide detailed information about tasks assigned to users, including:
- Task completion times and status
- User workload distribution
- Task performance metrics
- Screen-specific task filtering
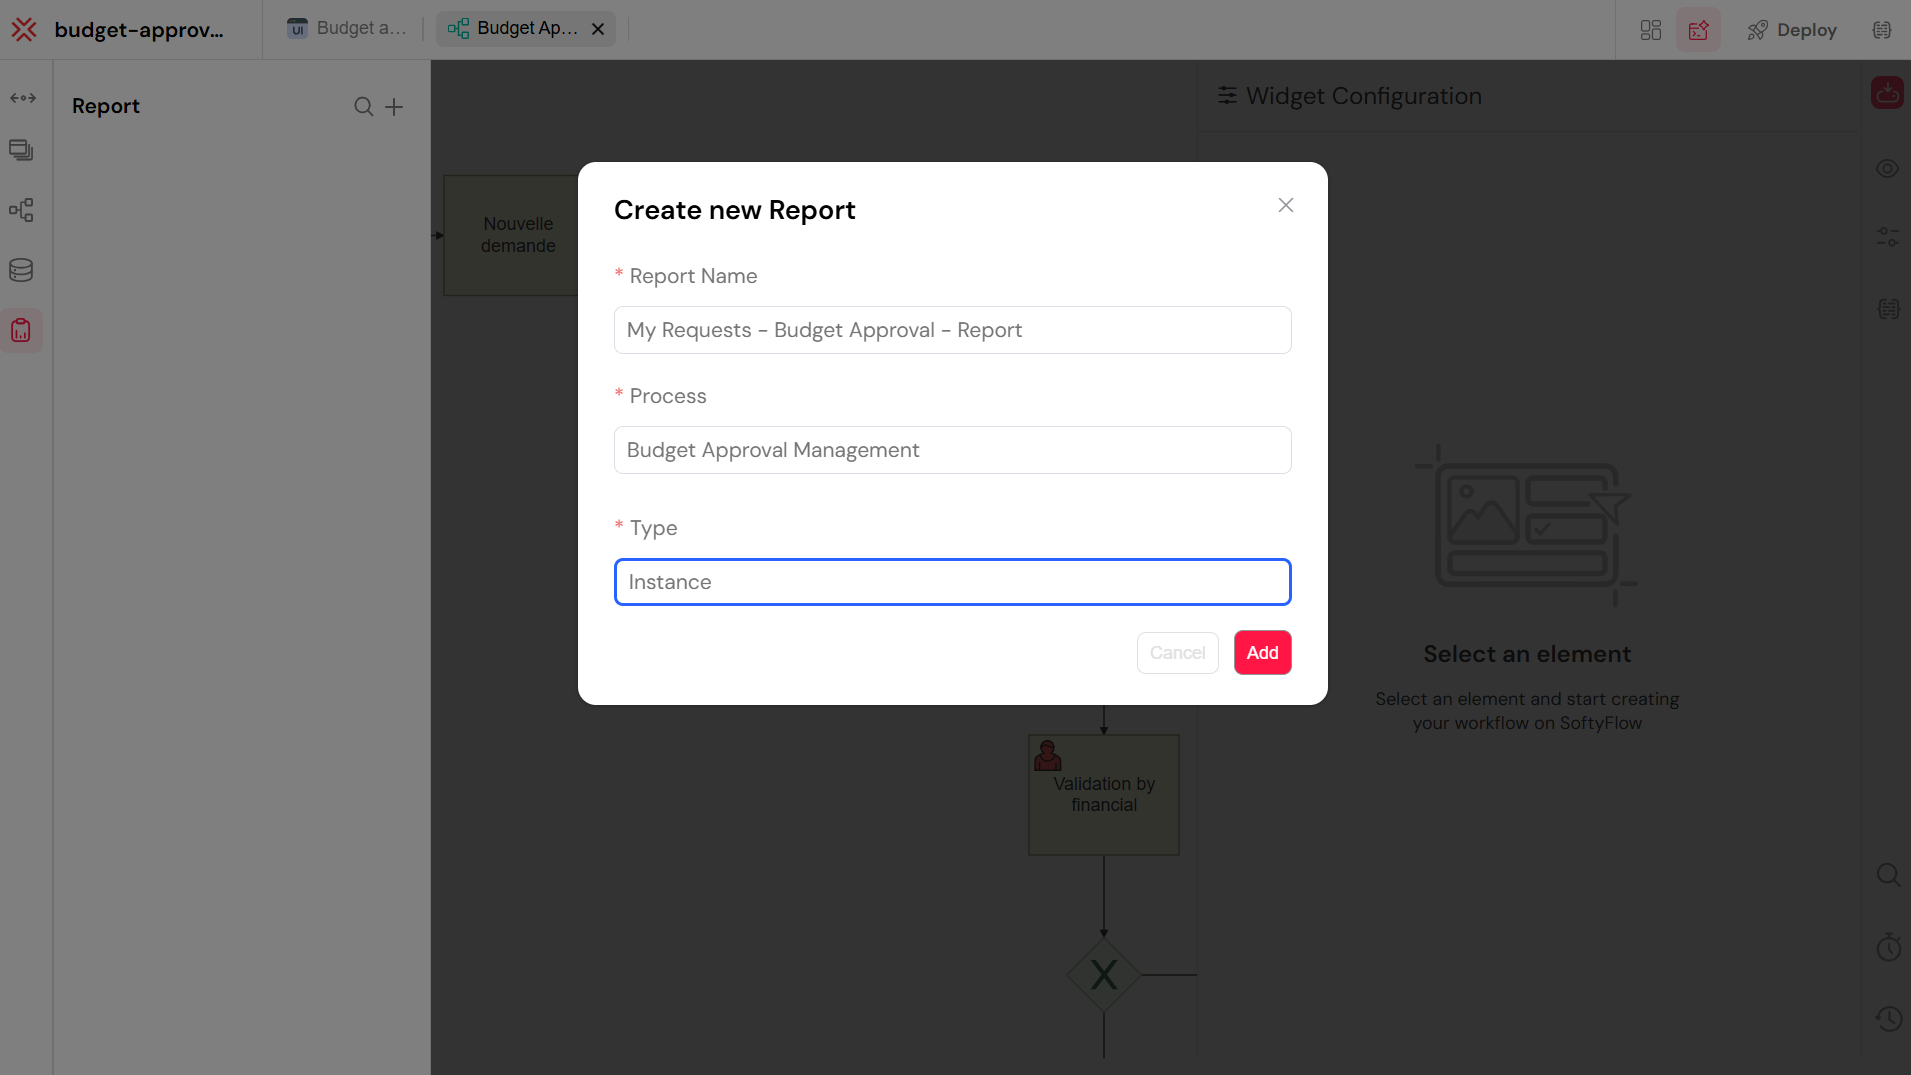
3. Creating Reports
3.1. Basic Setup
- Navigate to the Reports section in your project
- Click "Create New Report"
- Configure the essential details:
- Report Name: Choose a descriptive name
- Process: Select the target process
- Type: Choose Instance or Task report
3.2. Report Configuration
Once created, configure your report with these key settings:
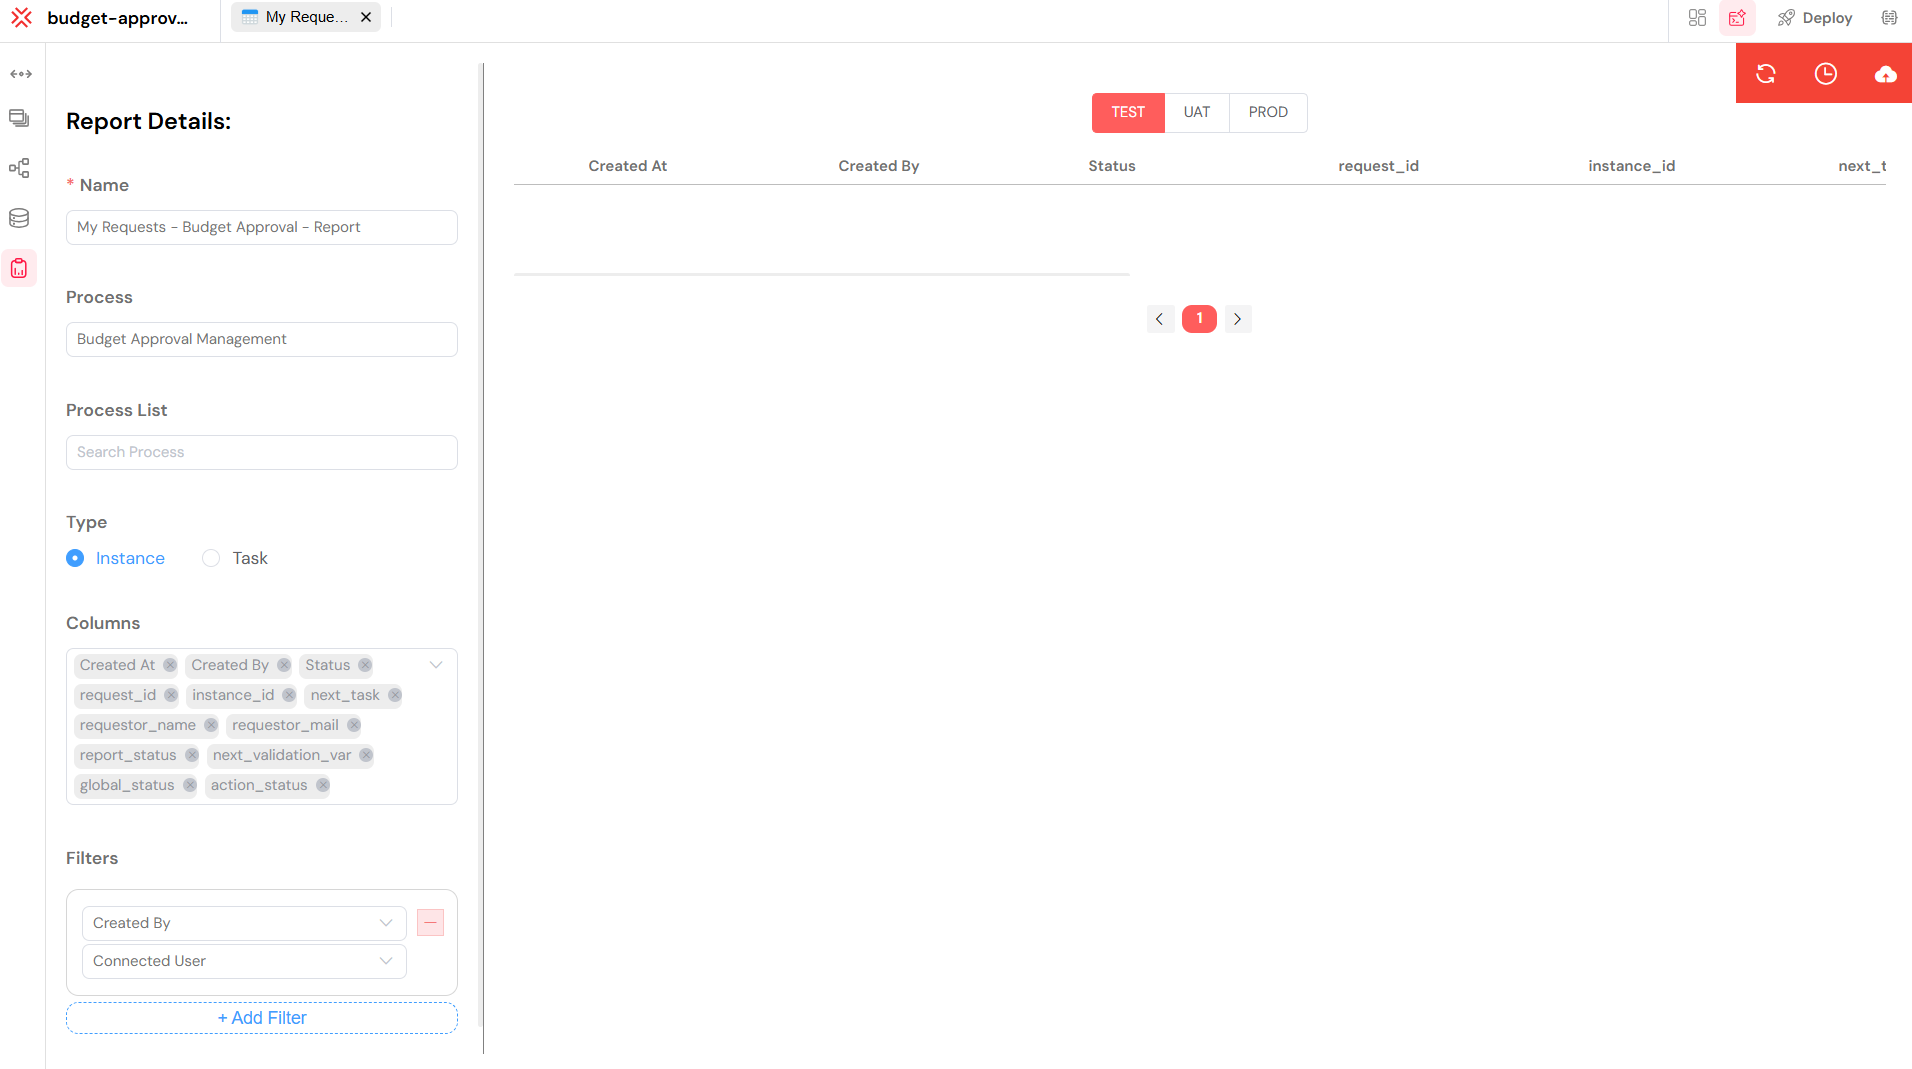
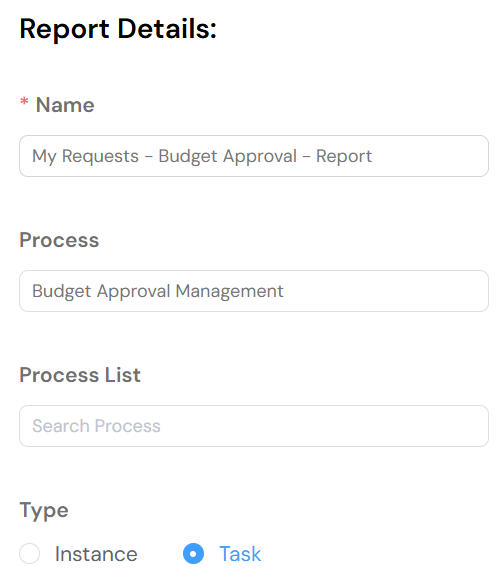
3.2.1. Core Settings
- Name: Modify the report name if needed
- Process: Change the target process
- Type: Switch between Instance and Task report types
3.2.2. Data Configuration
- Columns: Select which process measures to include
- Filters: Define conditions to filter your data
- Sort: Set default sorting preferences
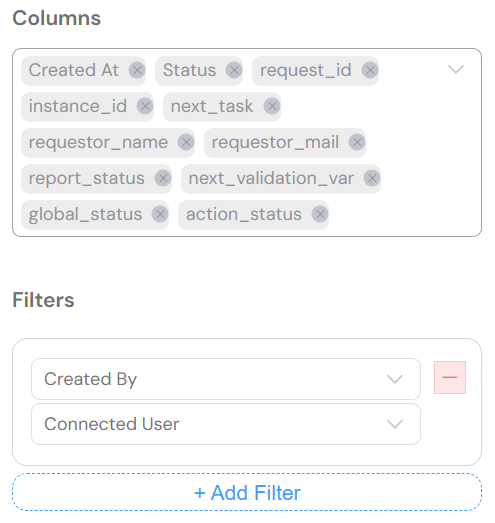
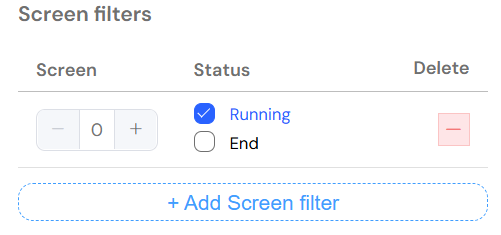
3.2.3. Task Report Specific
- Screen Filters: Filter tasks by specific process steps/screens
- State Filters: Show tasks by completion status (running, completed, etc.)
4. Displaying Reports with Tables
4.1. Table Widget Integration
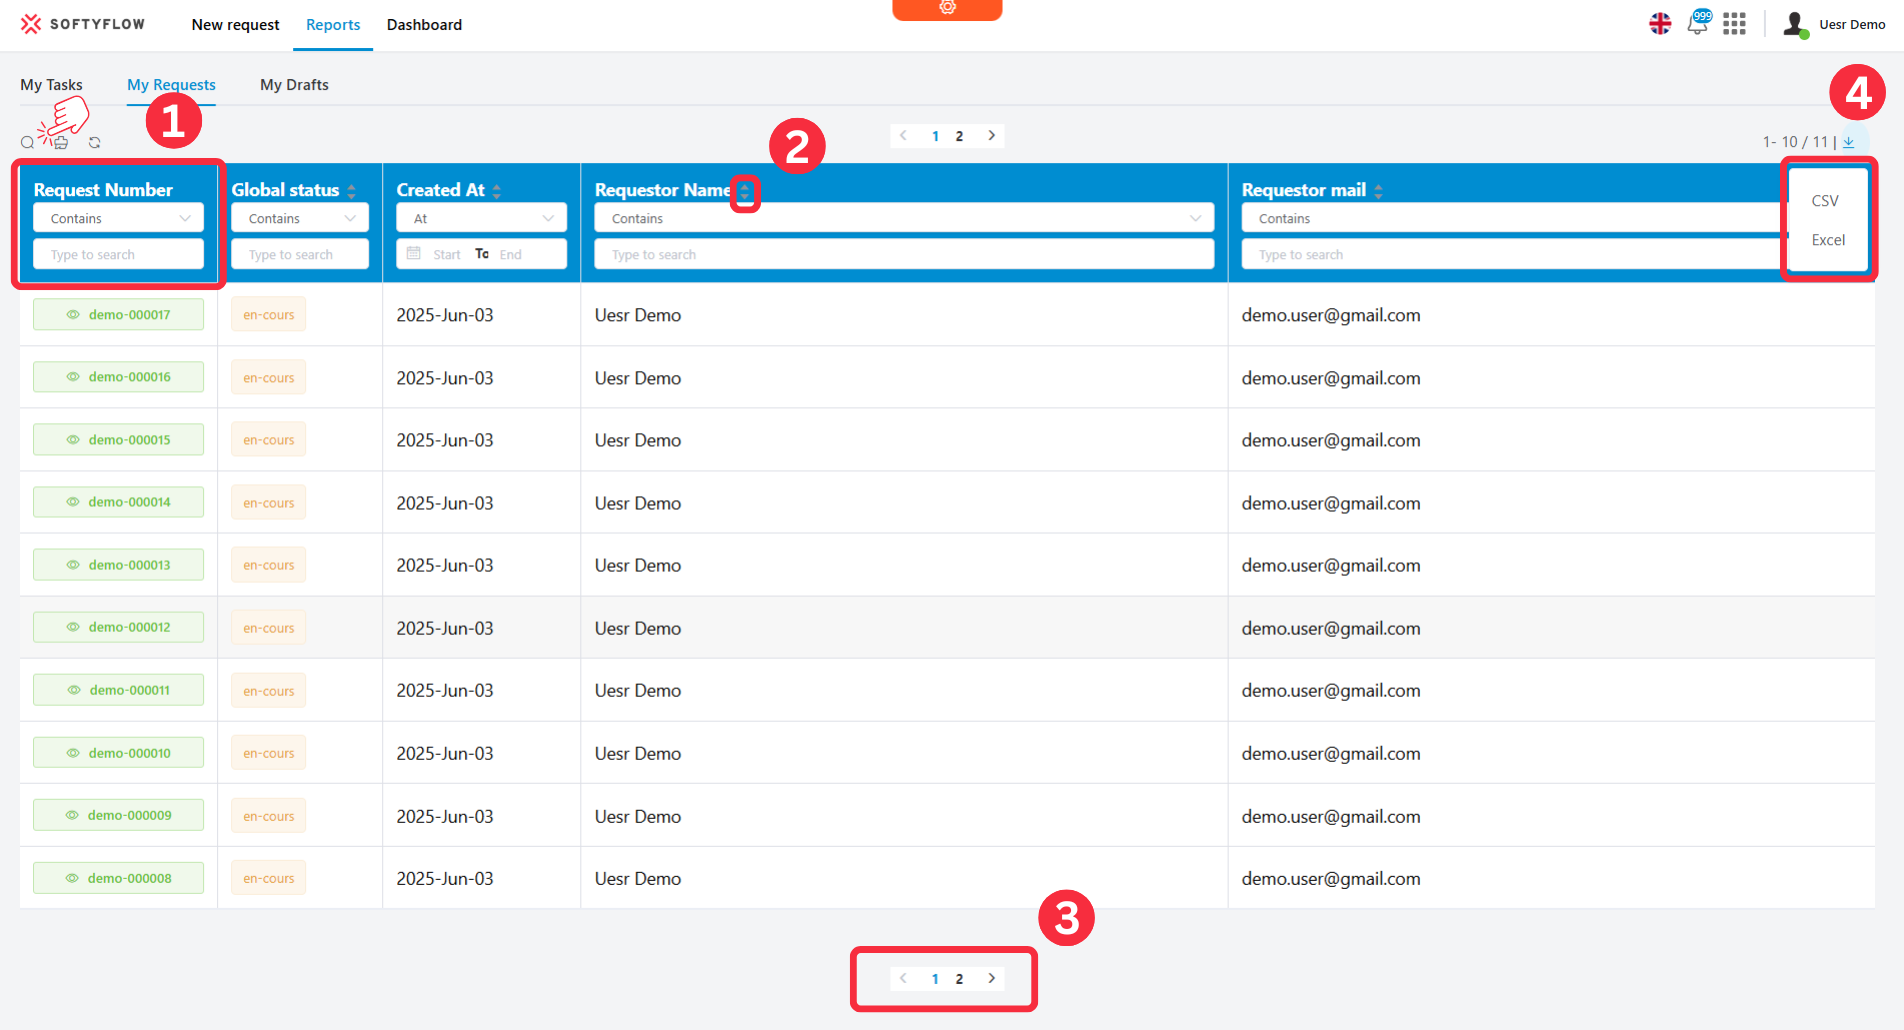
Reports can be displayed using the powerful Table widget in your web interfaces, which provides:
- Interactive Filtering: Real-time data filtering
- Sorting: Click-to-sort functionality
- Pagination: Handle large datasets efficiently
- Export: CSV and Excel export capabilities
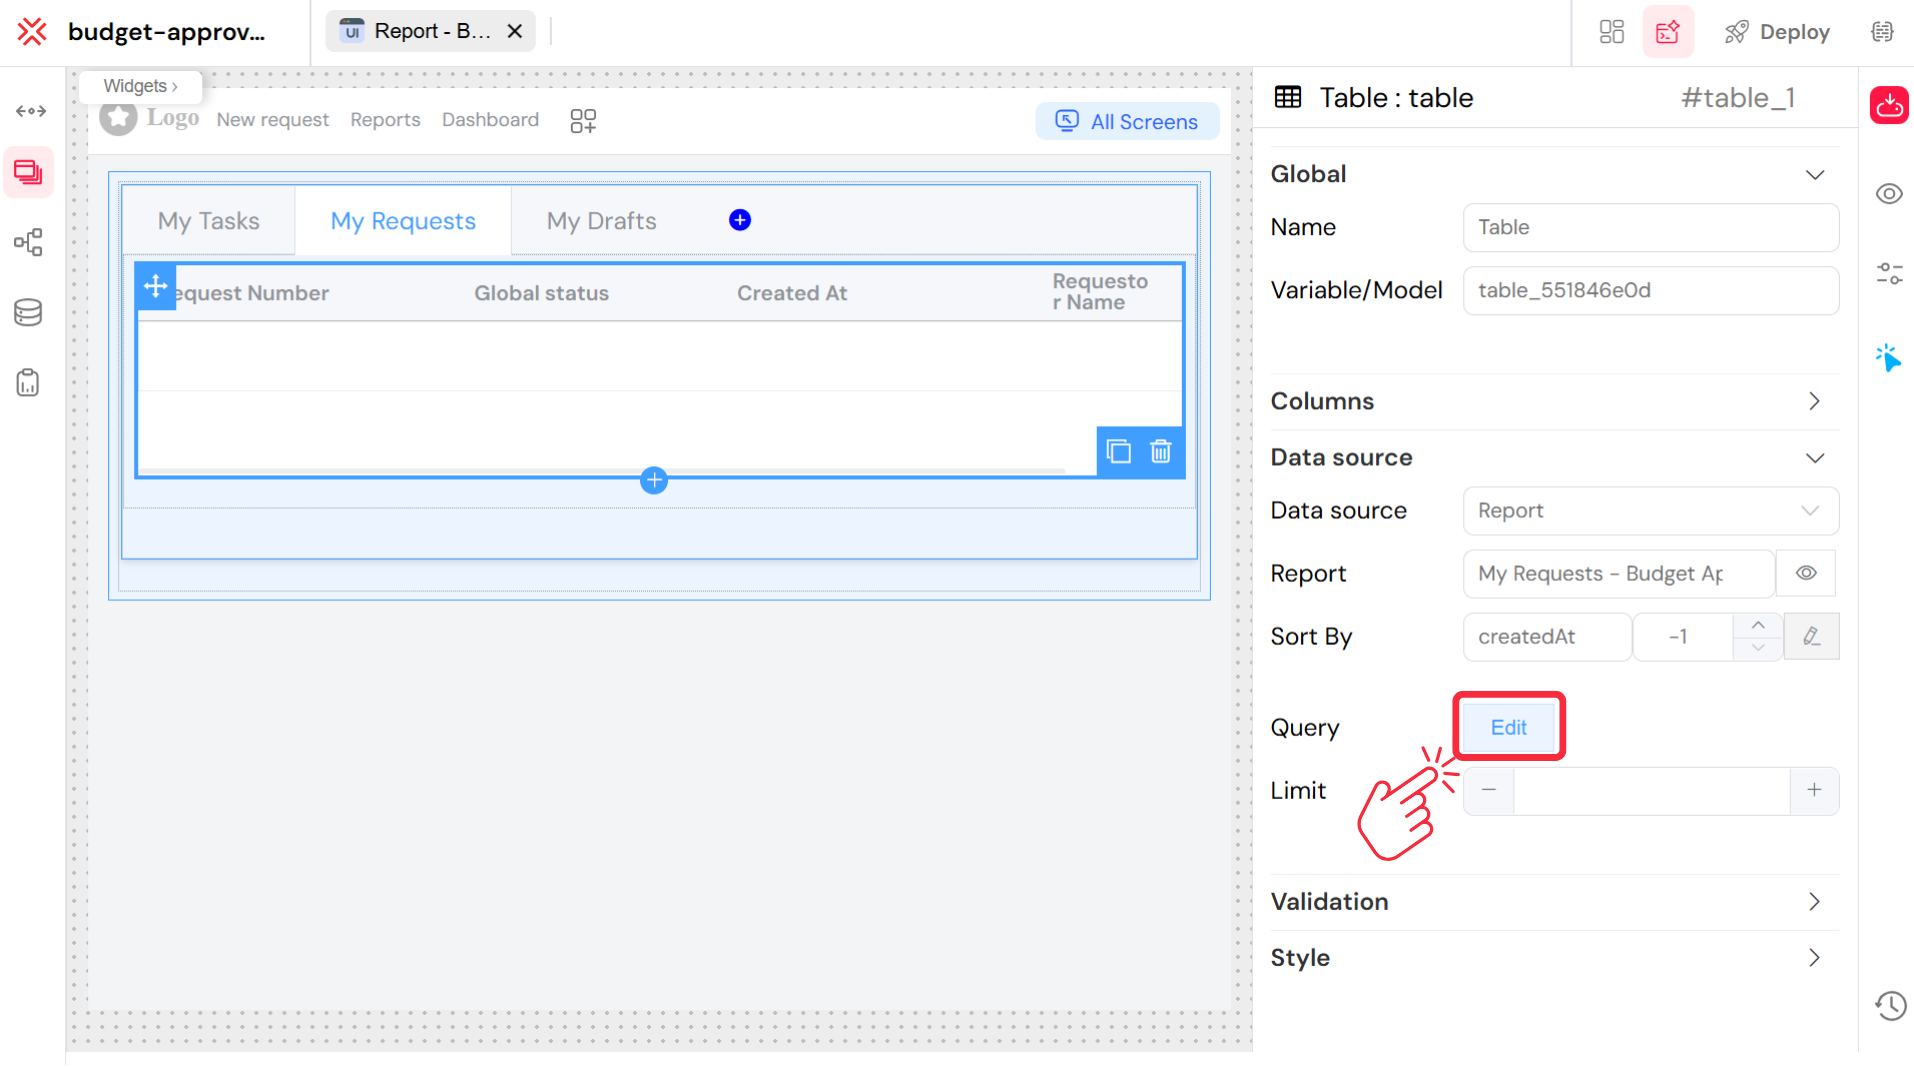
4.2. Data Source Configuration
When configuring a Table widget to display reports:
4.3. Advanced Table Features for Reports
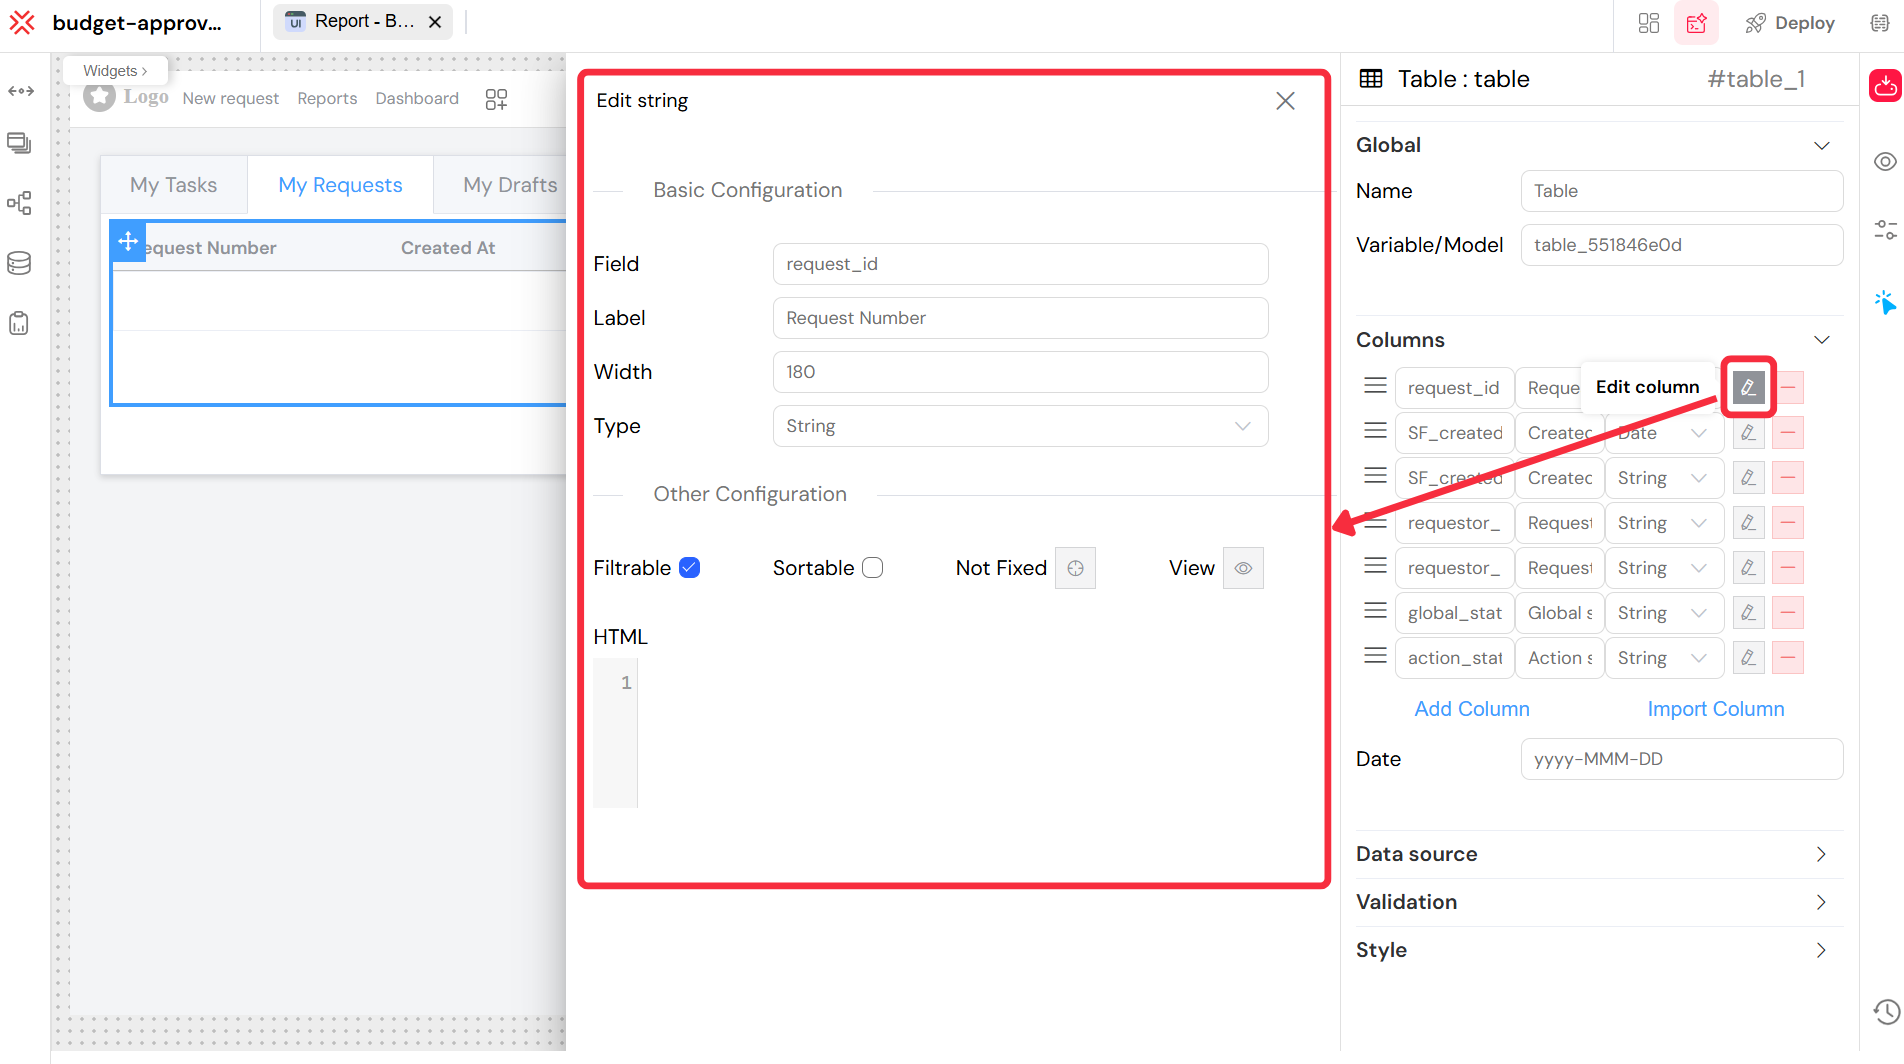
4.3.1. Column Types
- String: Process names, statuses, descriptions
- Date: Timestamps, deadlines, completion dates
- Number: Durations, counts, performance metrics
- Currency: Cost analysis, budget tracking
- Boolean: Completion flags, approval states
4.3.2. Interactive Features
- Real-time Filtering: Filter by date ranges, status, users
- Multi-column Sorting: Organize data by multiple criteria
- Row Selection: Select instances/tasks for bulk operations
- Export Options: Generate reports in CSV/Excel formats
4.3.3. Responsive Design
- Mobile Optimization: Touch-friendly controls
- Collapsible Details: Expandable row information
- Adaptive Layout: Automatic column adjustment
5. Query and Filtering
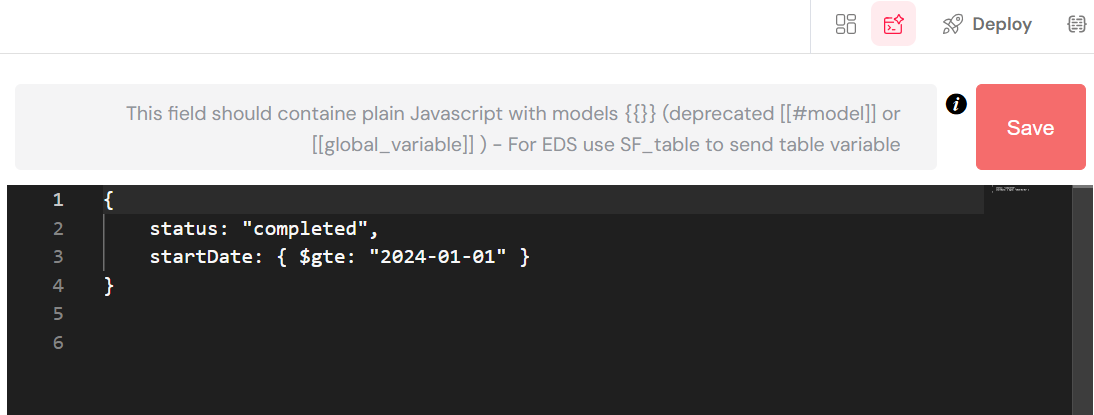
5.1. Basic Filtering
Use simple expressions to filter your report data:
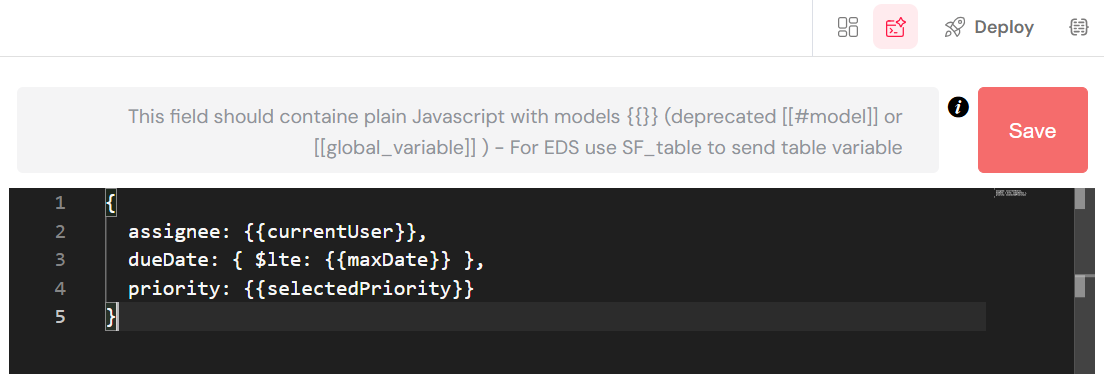
5.2. Dynamic Filtering
Include variables for interactive filtering:
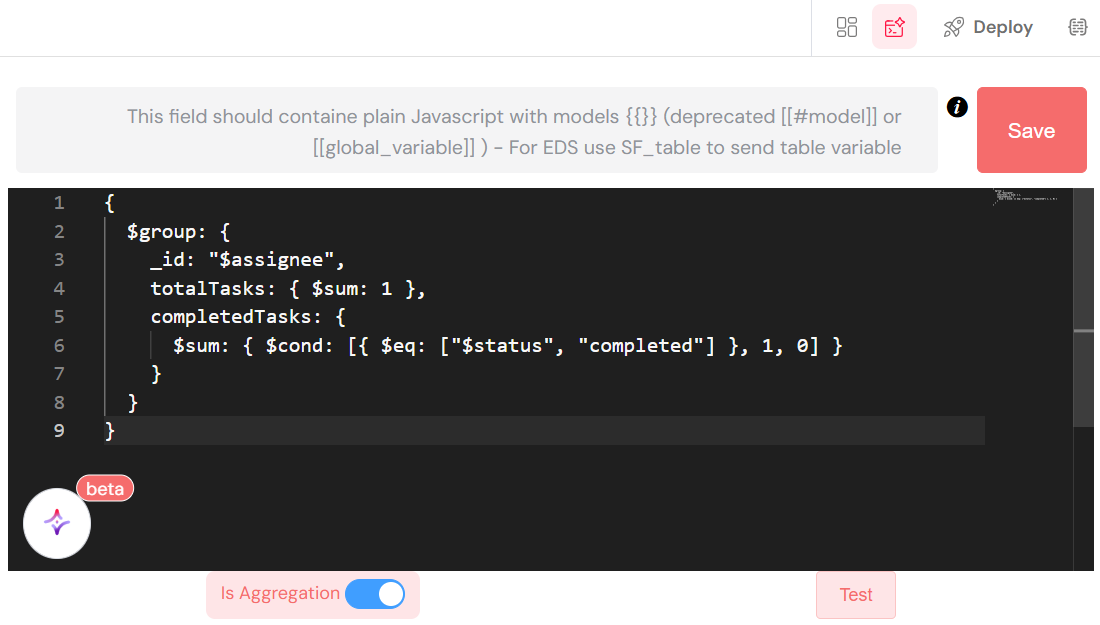
5.3. Advanced Queries
For complex analytics, use aggregation queries:
6. Process Measures
Reports automatically include key process measures from your process design:
6.1. Instance Measures
- Instance ID: Unique identifier
- Process Name: Associated process
- Start/End Dates: Execution timeline
- Status: Current state (running, completed, failed)
- Duration: Execution time
- Initiator: User who started the process
6.2. Task Measures
- Task ID: Unique task identifier
- Task Name: Human-readable task name
- Assignee: Responsible user
- Due Date: Task deadline
- Completion Date: When task was finished
- Screen: Associated process step
- Priority: Task importance level
7. Security and Access Control
Reports respect Softyflow's security model:
- Role-based Access: Users see only data they're authorized to view through role management
- Process Permissions: Reports inherit process-level security
- Data Filtering: Automatic filtering based on user context
- Audit Trail: Report access and modifications are logged in system logs
8. Best Practices
8.1. Report Design
- Clear Naming: Use descriptive report names
- Relevant Columns: Include only necessary data points
- Logical Grouping: Organize related measures together
- Performance: Limit data scope for better performance
8.2. Table Configuration
- Appropriate Limits: Use pagination for large datasets
- Smart Filtering: Provide useful filter options
- Export Ready: Configure columns for easy export
- Mobile Friendly: Ensure responsive design
8.3. Query Optimization
- Specific Filters: Use targeted queries to reduce data load
- Index Fields: Filter on indexed database fields
- Reasonable Limits: Balance completeness with performance
- Cache Strategy: Consider data refresh requirements
9. Troubleshooting
9.1. Common Issues
- No Data Showing: Check process permissions and query syntax
- Slow Performance: Reduce query scope or add filters
- Missing Columns: Verify process measures configuration
- Export Problems: Check data types and formatting settings
9.2. Debug Tips
- Test queries independently before adding to reports
- Use browser developer tools to inspect data loading
- Verify user permissions for target processes
- Check console for error messages during report generation
Next Steps
Now that you understand reporting, continue building your application:
- Web Interface Design - Create interfaces to display your reports
- Process Design - Design processes that generate reportable data
- Database Integration - Connect to data sources for reporting
- Integration - Integrate external data into your reports
- Test & Deploy - Test your reports across environments
- Monitor & Run - Monitor your processes and generate reports
For hands-on experience, try our step-by-step tutorials or watch our process and reports video tutorials.
For advanced reporting features, explore our Reports documentation, Table widget, and Process Measures guides.