Monitor & Run
The Monitor & Run page is your central hub for monitoring and managing all running process instances in Softyflow. This comprehensive interface allows you to track process execution, manage tasks, handle errors, and control instance lifecycle.
Before using monitoring features, ensure you've deployed your applications and understand your process design and web interfaces.
Overview
The Run page provides real-time monitoring capabilities with:
- Process Statistics Dashboard: Overview of running, completed, and error instances
- Instance Management: Search, filter, and manage process instances
- Task Monitoring: Track and assign tasks to users and groups
- Error Handling: View and manage process errors with system logs
- Process Control: Start, pause, resume, and terminate processes
Finding Launched Processes
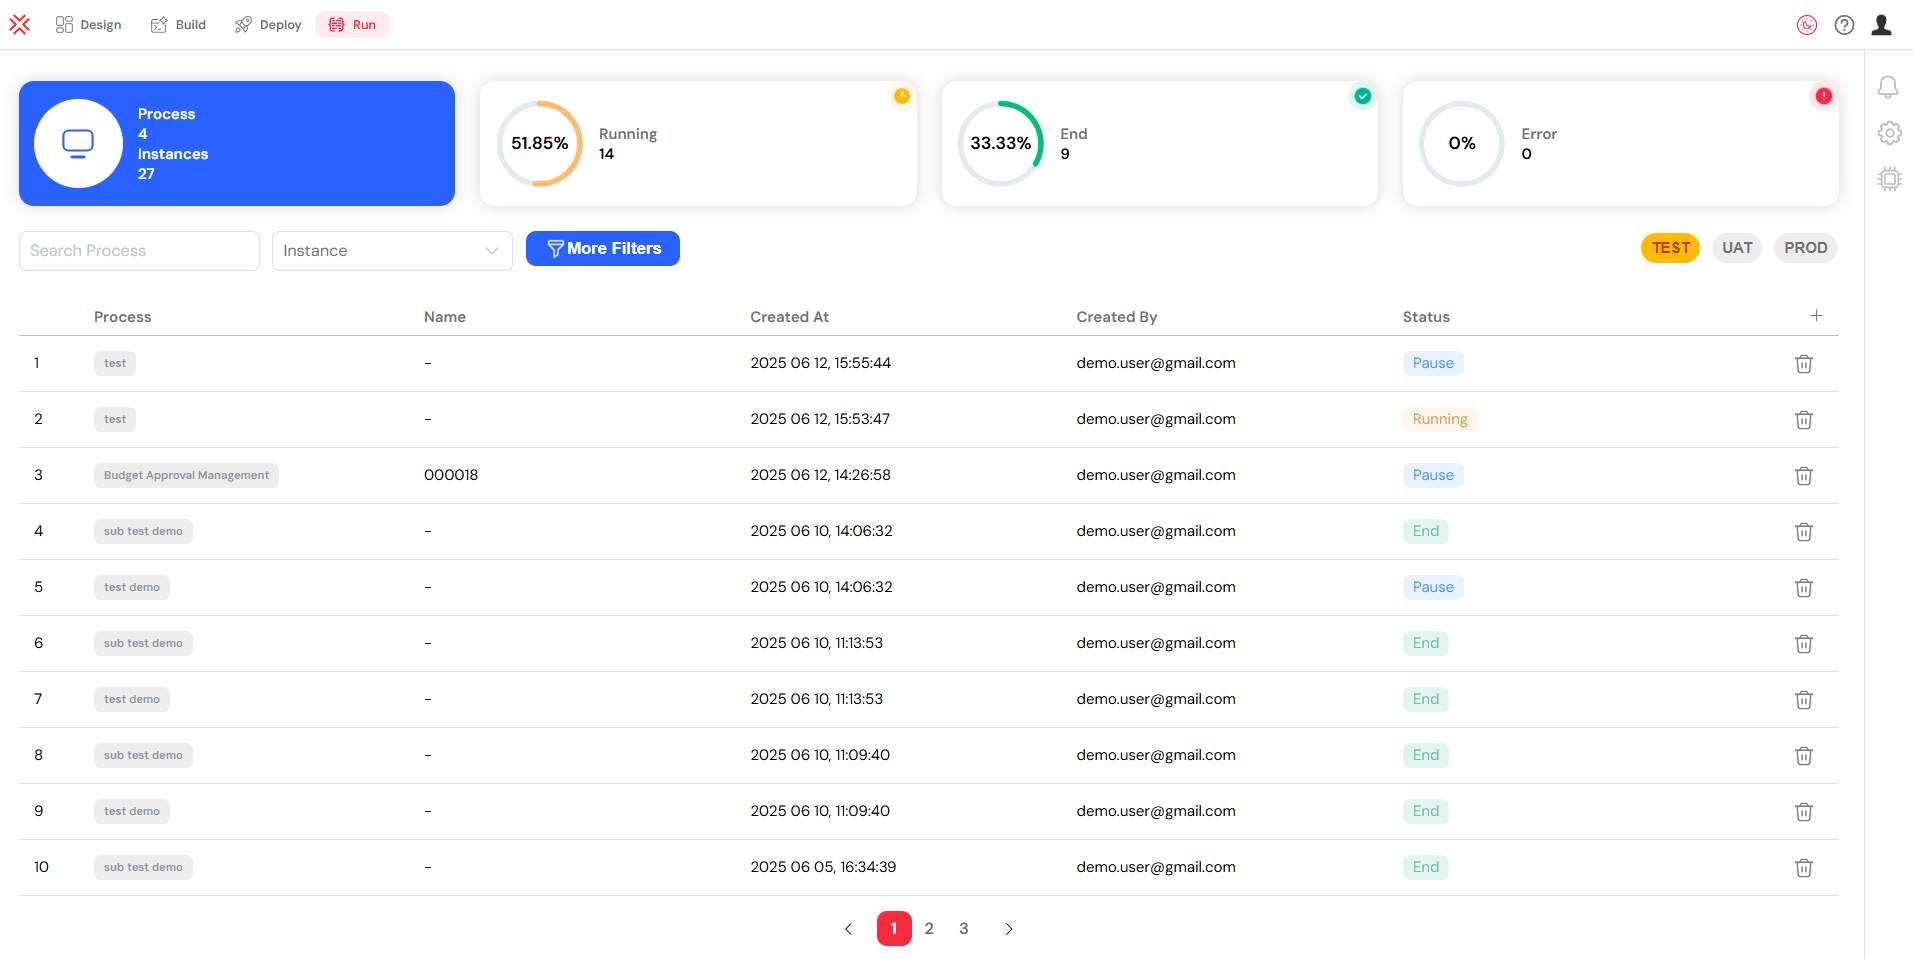
Process Statistics Dashboard
The top section displays key metrics:
- Process Count: Total number of processes and instances
- Running Instances: Currently executing processes with progress indicators
- Completed Instances: Successfully finished processes
- Error Count: Processes that encountered errors

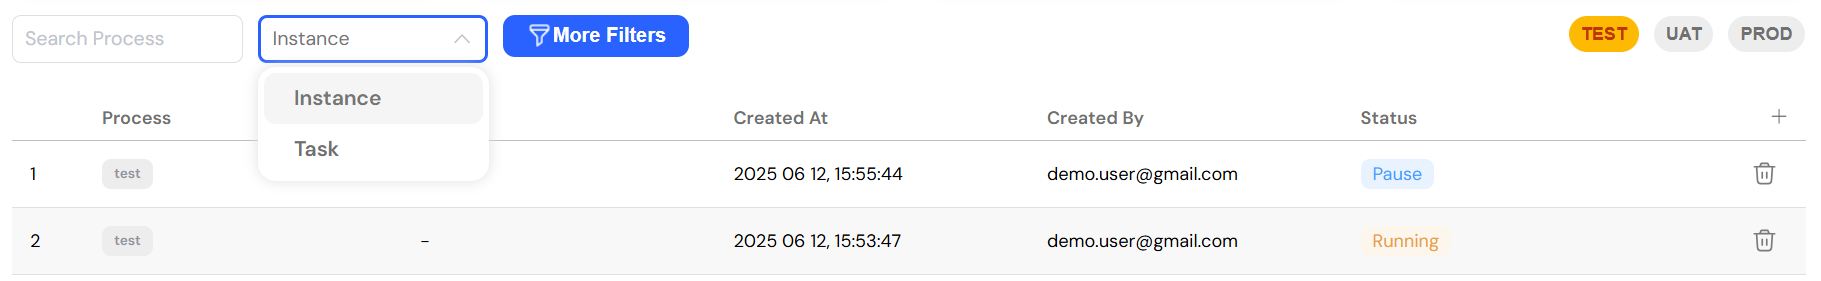
Search and Filter Options
Basic Filters
- Process Search: Use the dropdown to search for specific processes by name
- Type Filter: Choose between "Instance" or "Task" view
- Environment Mode: Switch between TEST, UAT, and PROD environments
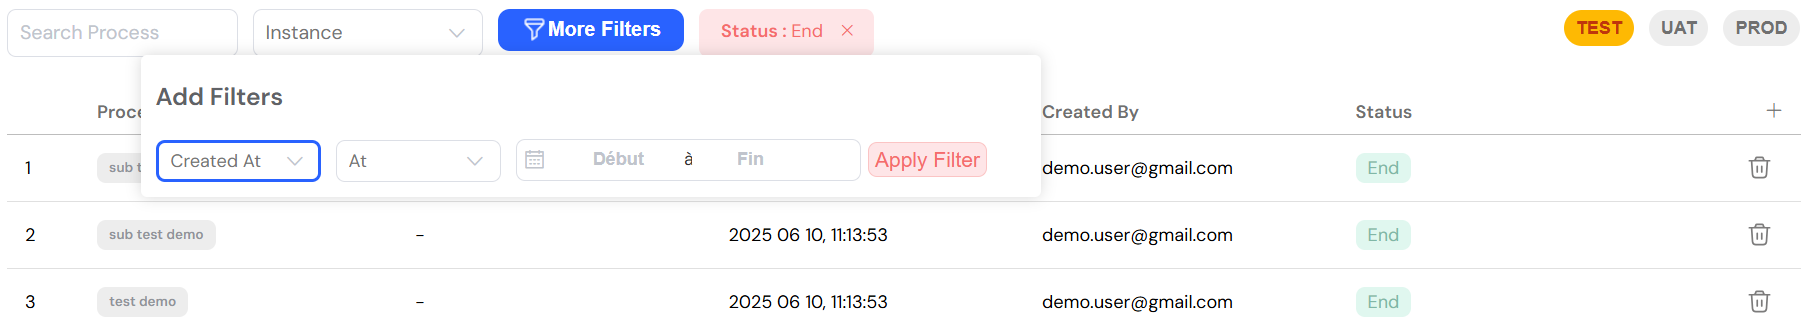
Advanced Filtering
Click "More Filters" to access advanced options:
- Column-based Filters: Filter by any available column
- Date Ranges: Filter by creation date, completion date, etc.
- Status Filters: Filter by Running, End, Error, or Pause status
- User Filters: Filter by assigned users or creators
- Custom Operators: Use equals, contains, starts with, ends with, etc.
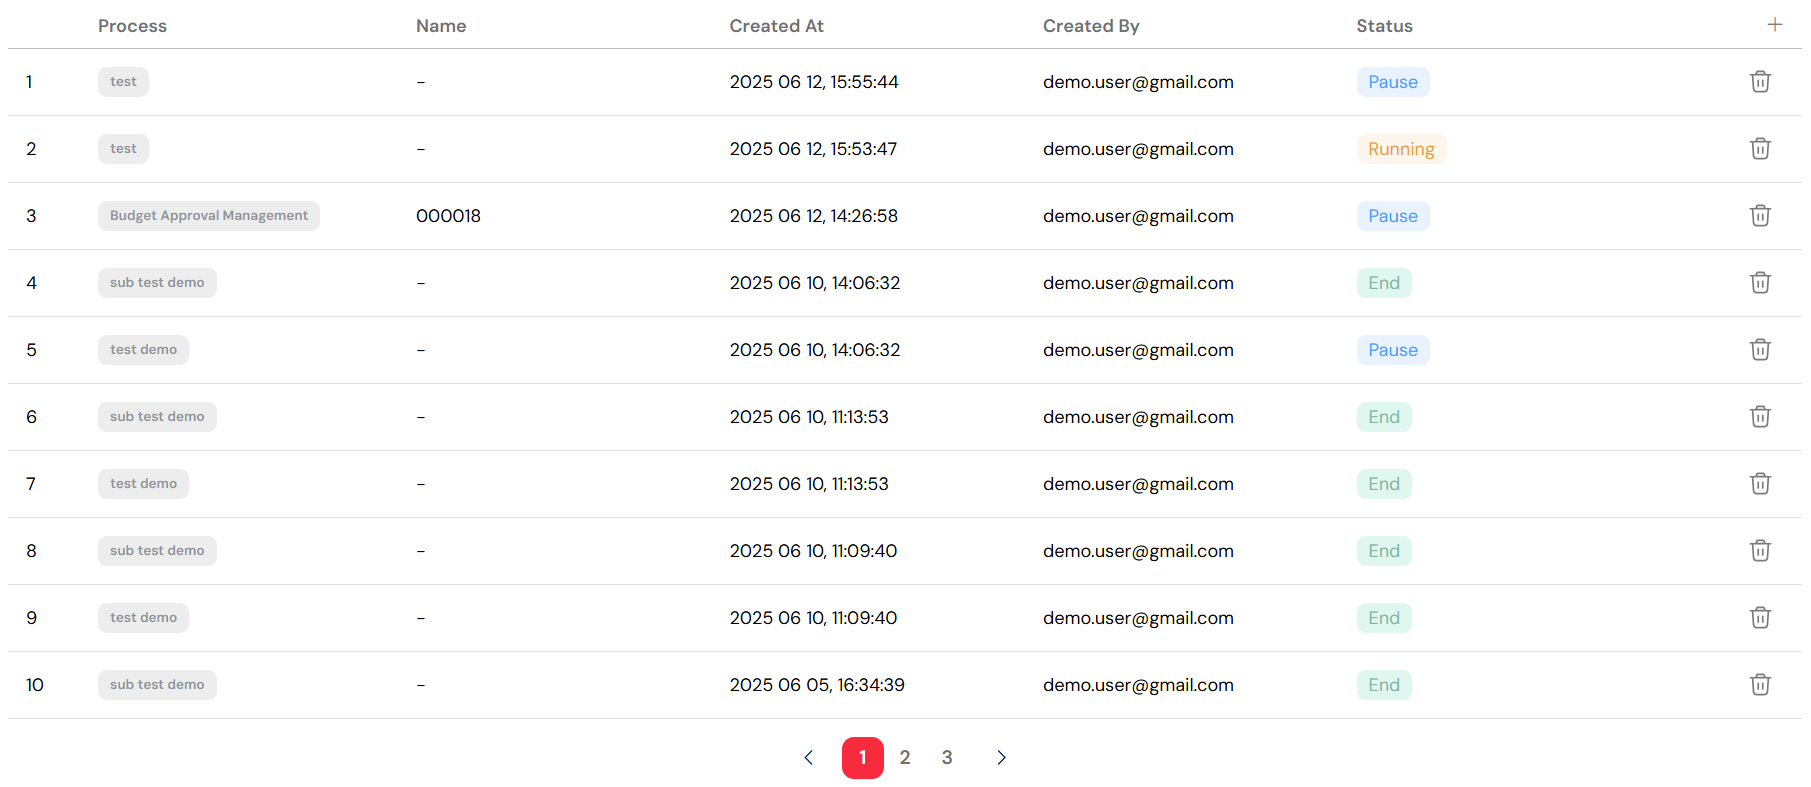
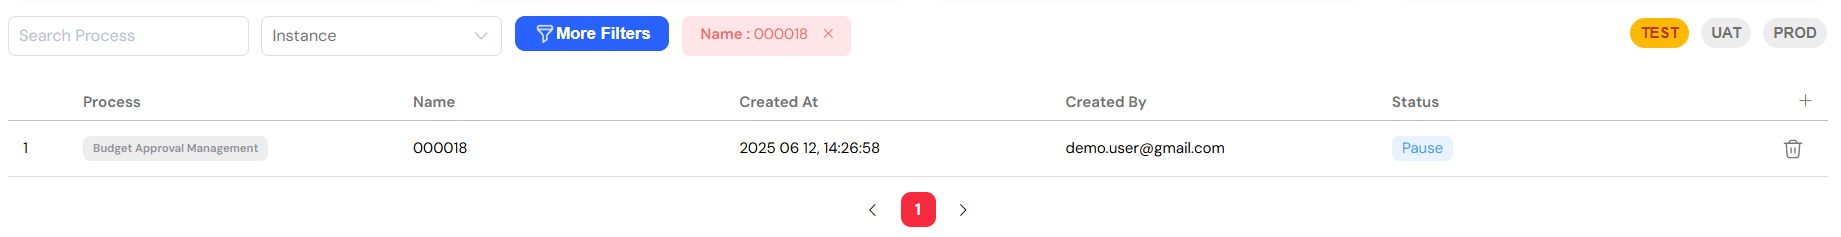
Instance Table
The main table displays:
- Index: Sequential numbering
- Process Name: Name of the process (if not filtered by specific process)
- Status: Current instance status with color coding
- Assigned Users: Users assigned to tasks
- Custom Columns: Configurable columns based on your needs
Viewing Errors
Error Statistics
The dashboard shows error counts with visual indicators. Click on the error section to see detailed error information.
Instance-Level Errors
- Error Badge: Each instance with errors shows an error badge
- Error Details: Click on an instance to view detailed error information
- Error Drawer: Access the error drawer from the instance detail view
Error Notifications Setup
Configure error notifications in the right panel:
- Click the Notification icon in the right toolbar
- Add Users: Select users to receive error notifications
- Set Frequency: Choose Daily, Weekly, or Monthly notifications
- Save Configuration: Apply the notification settings
Viewing Tasks and Assignments
Task View Mode
- Switch to "Task" type in the filter dropdown
- View all tasks across instances with their assignments
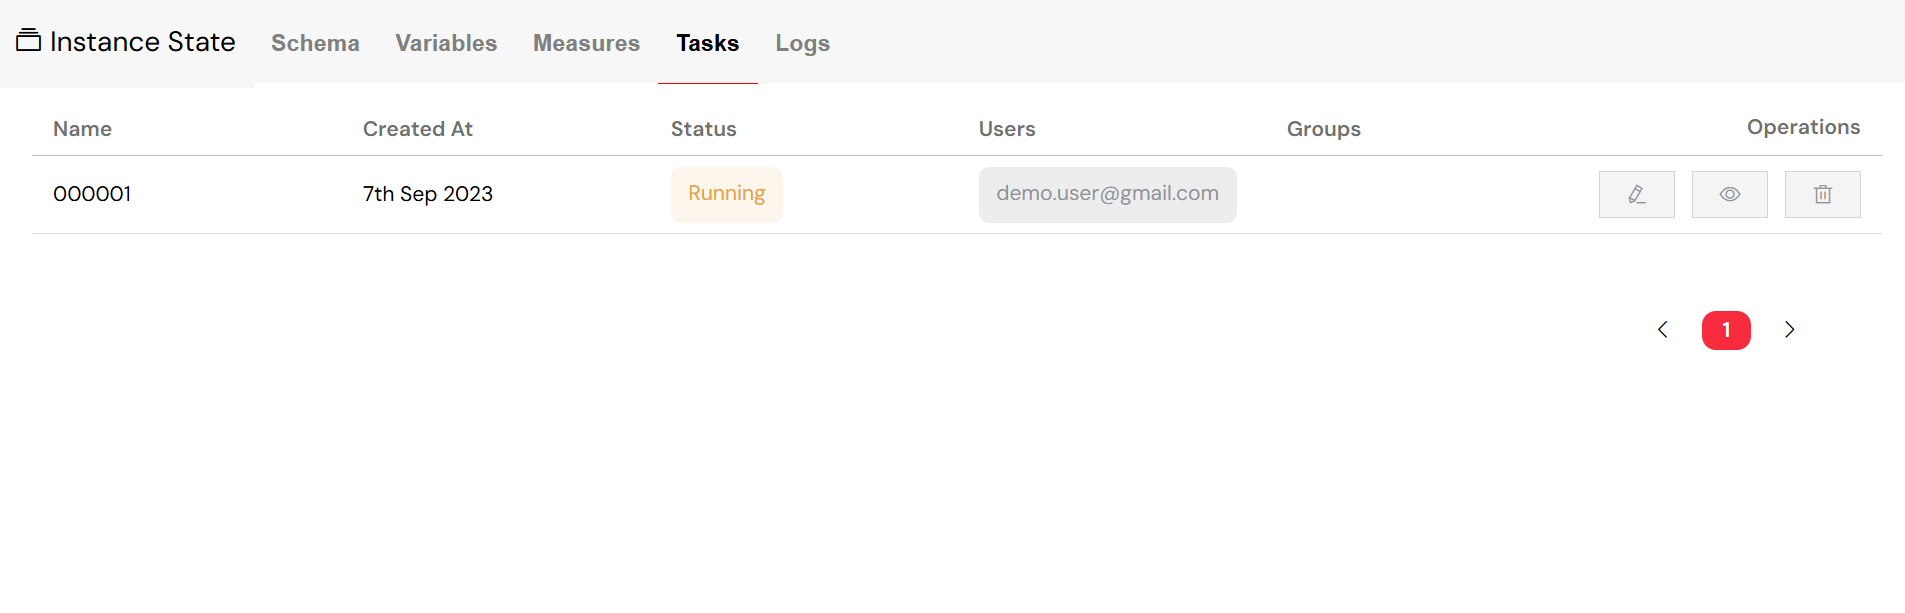
Task Information
For each task, you can see:
- Task Name: Descriptive name of the task
- Creation Date: When the task was created
- Status: Running, End, or Error
- Assigned Users: Individual users assigned to the task
- Assigned Groups: User groups assigned to the task

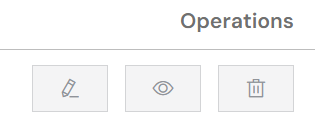
Task Management
From the instance detail view:
- Edit Tasks: Modify user and group assignments
- View Tasks: Open task interface for execution
- Delete Tasks: Remove tasks if necessary
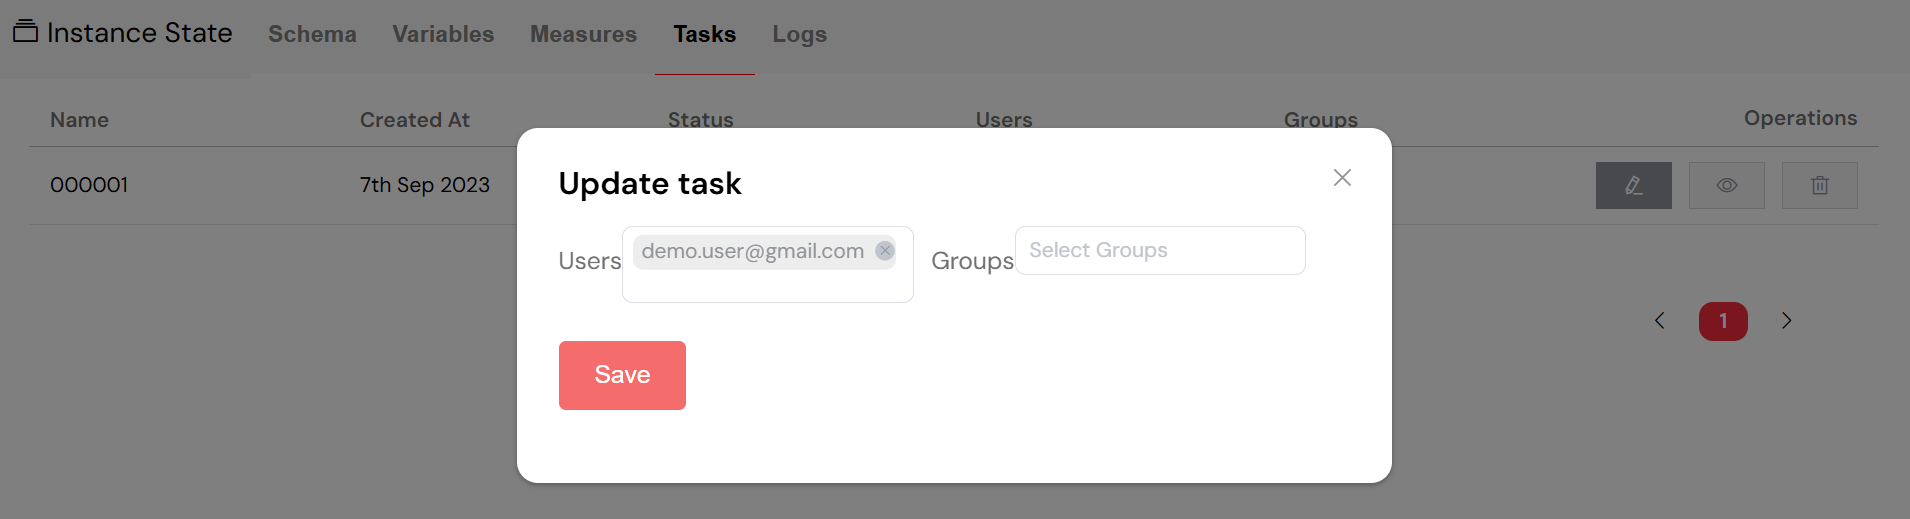
Task Assignment Process
- Select Task: Click the edit button on a task
- Modify Users: Add or remove individual users
- Modify Groups: Add or remove user groups
- Save Changes: Apply the new assignments
Restarting a Process
Paused Instance Revival
For paused instances:
- Open Instance: Click on the paused instance
- Schema View: Navigate to the schema tab
- Revive Button: Click the play button (▶️) in the toolbar
- Select Activity: Choose the activity to resume from
- Confirm Revival: Click "Revive" to restart the process
Version Switching
Before restarting, you can switch versions:
- Version Button: Click the version button in the toolbar
- Switch Version: Click the dropdown arrow next to the revive button
- Select Version: Choose from available versions
- Apply Changes: Confirm the version switch
Activity Management
In the schema view:
- Add Activities: Click on process elements to add missing activities
- Edit Activities: Modify activity status and timing
- Save Changes: Apply activity modifications before revival
Closing a Process
End Instance
To properly close a running instance:
- Open Instance: Navigate to the instance detail view
- End Button: Click the success button (✓) in the toolbar
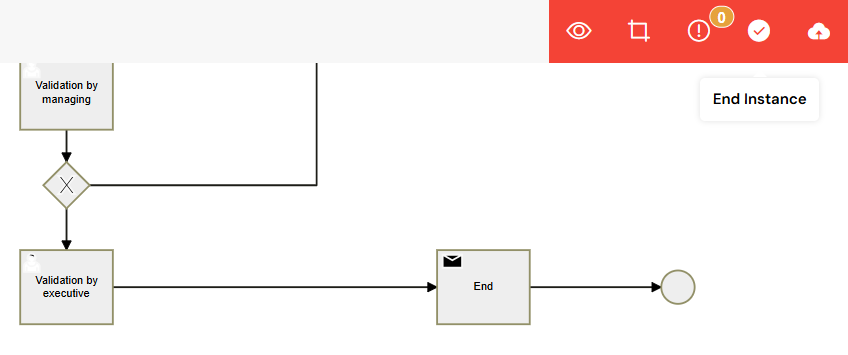
- Confirm Action: Confirm that you want to end the instance
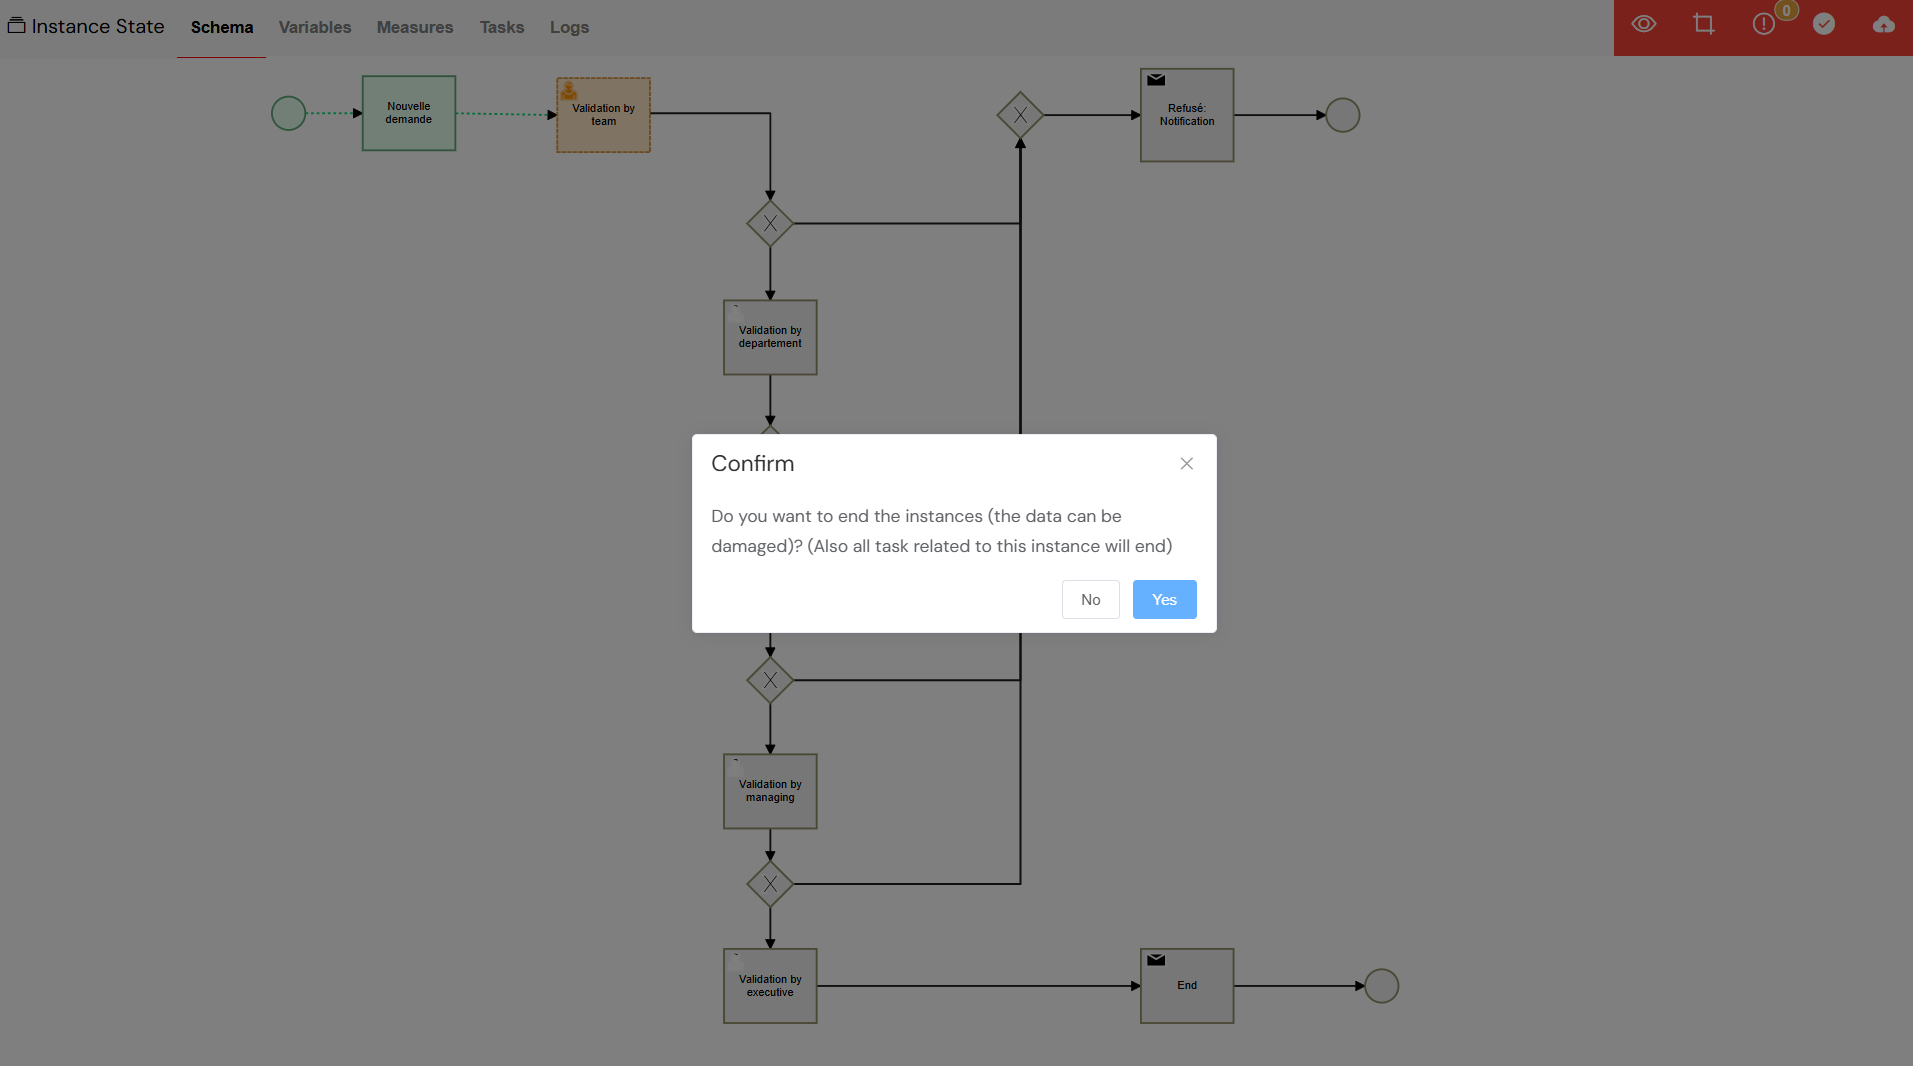
- Automatic Cleanup: The system will:
- End all running tasks
- Update instance status to "End"
- Complete all pending activities
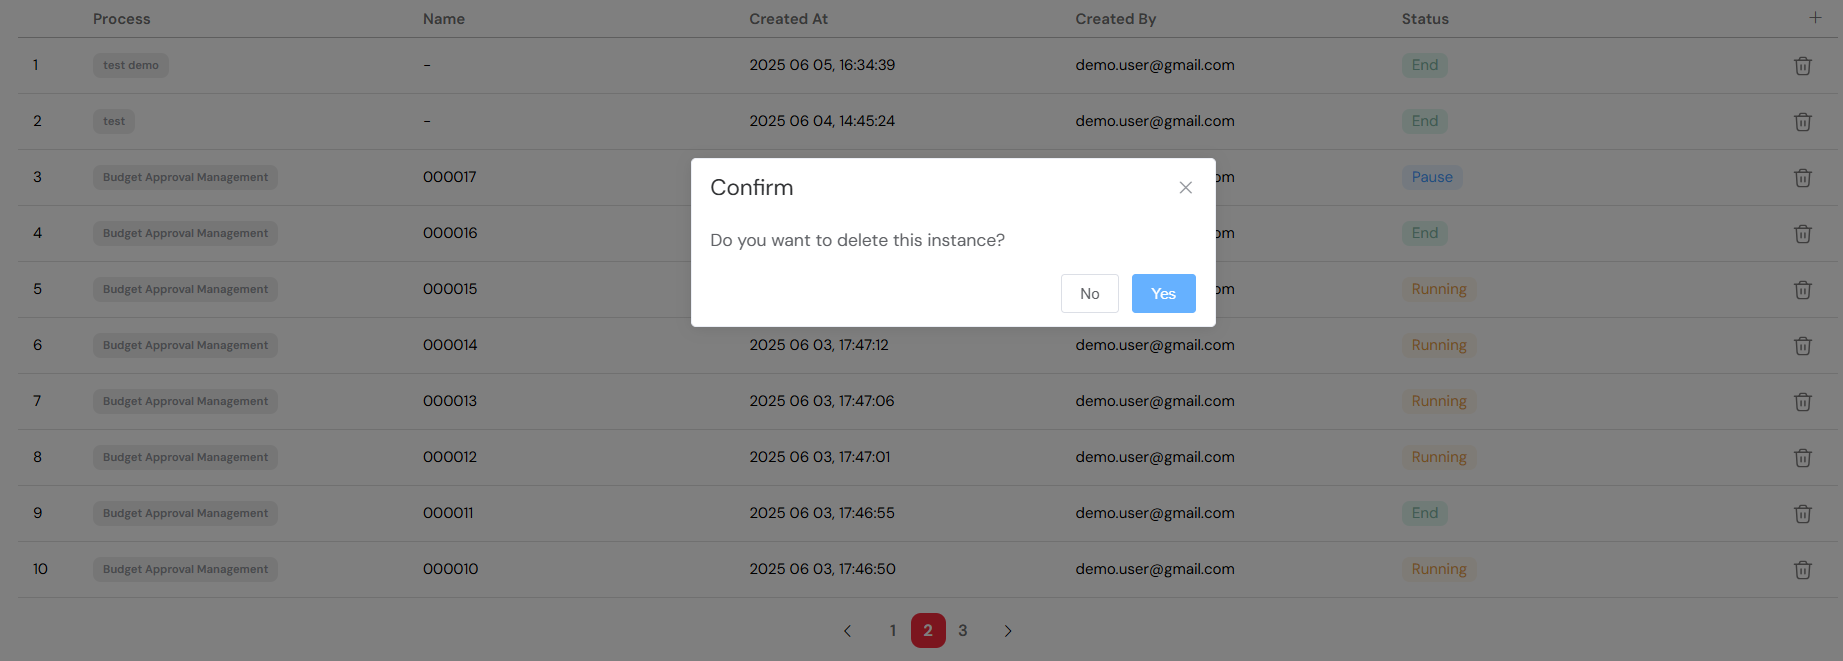
Force Termination
For problematic instances:
- Delete Option: Use the delete button in the instance table
- Confirm Deletion: Confirm the permanent removal
- Data Loss Warning: Be aware that this may cause data loss
Bulk Operations
For multiple instances:
- Filter Selection: Use filters to identify target instances
- Individual Actions: Process each instance individually
- Monitor Progress: Track the completion of bulk operations
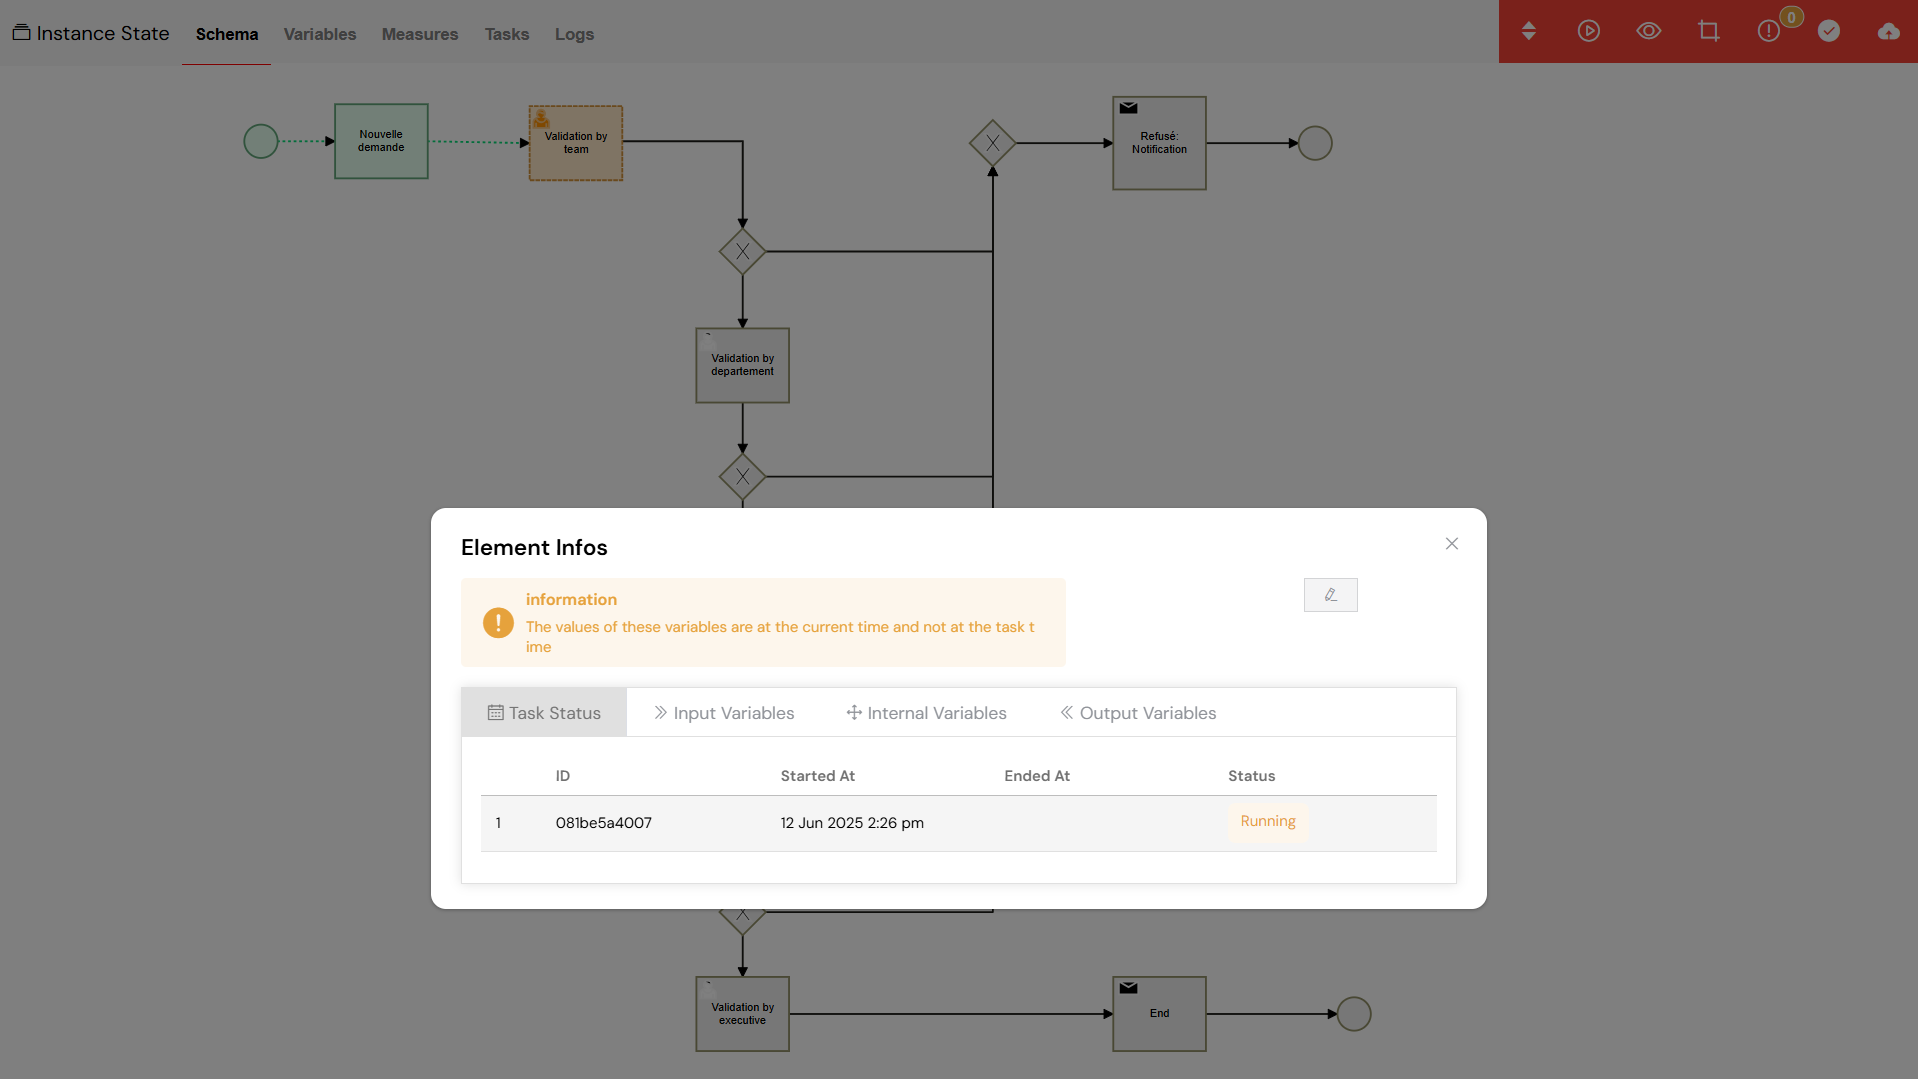
Instance Detail Views
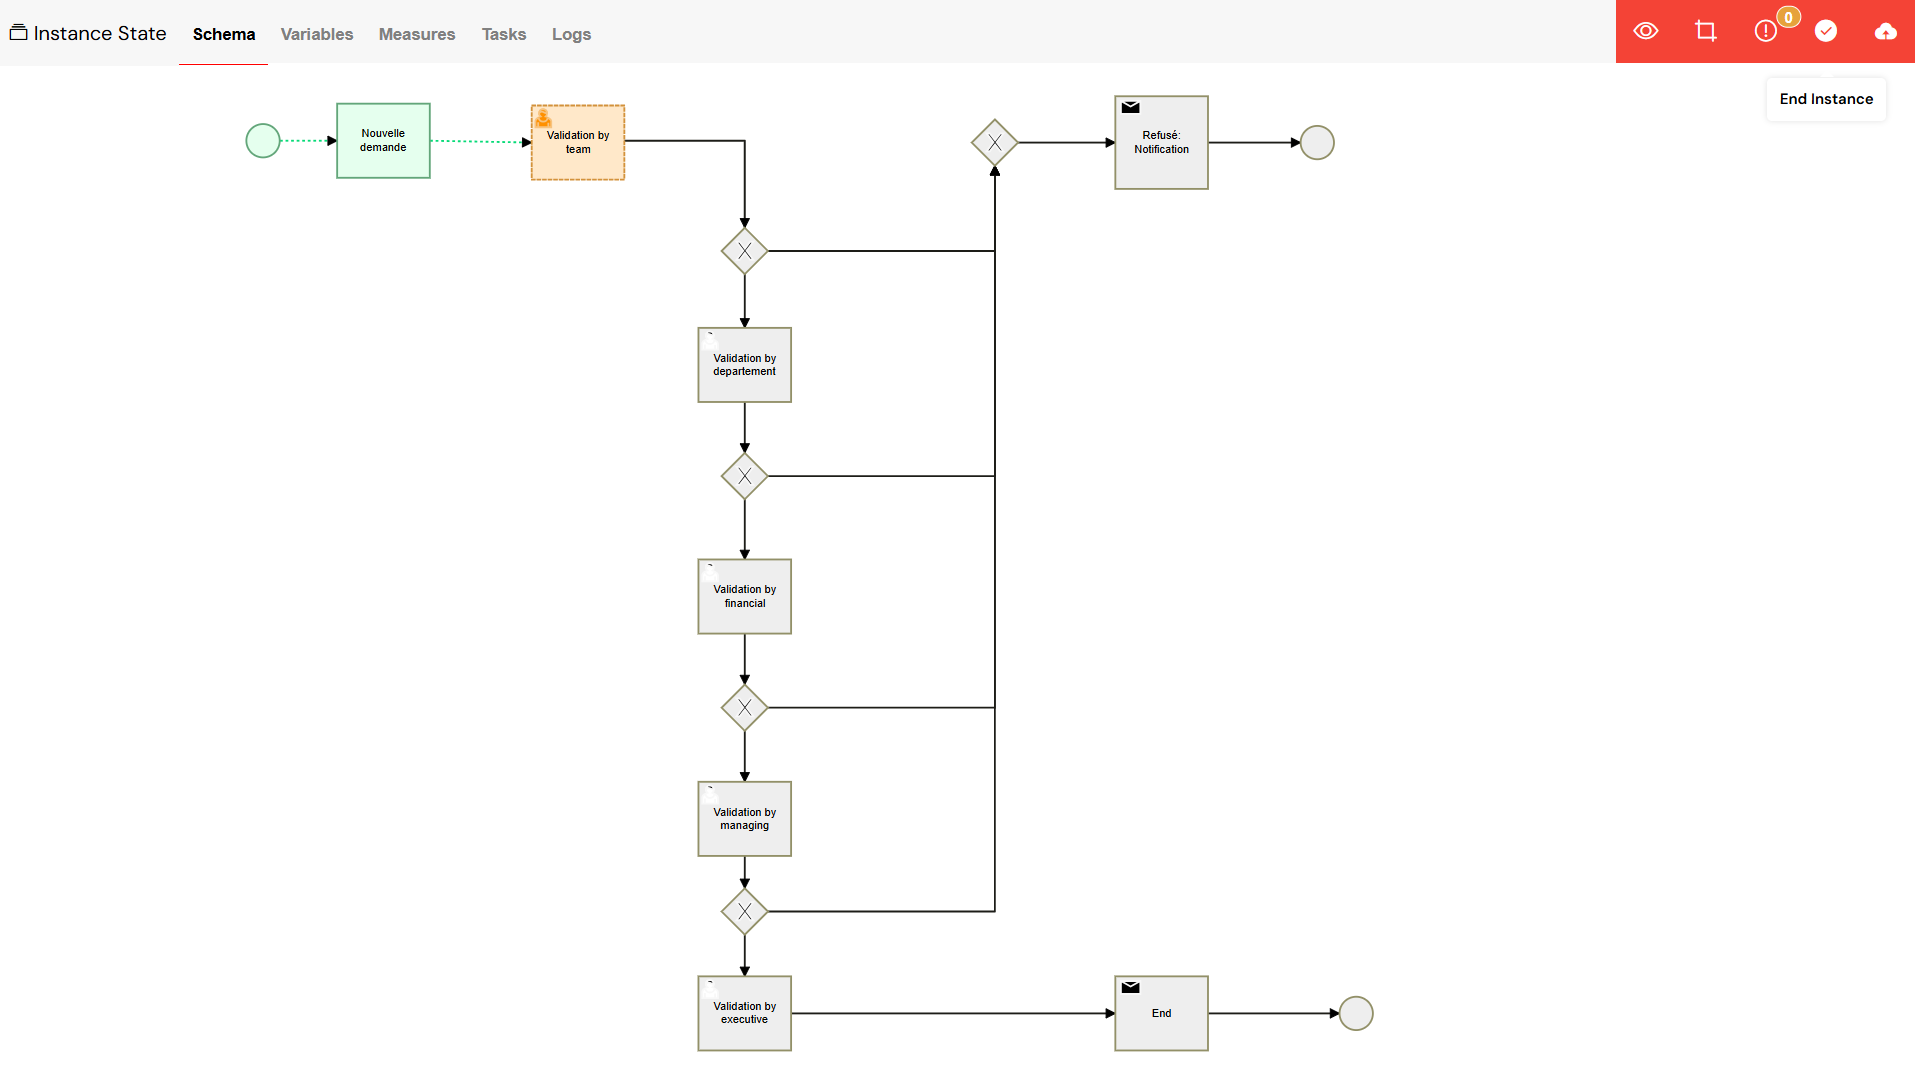
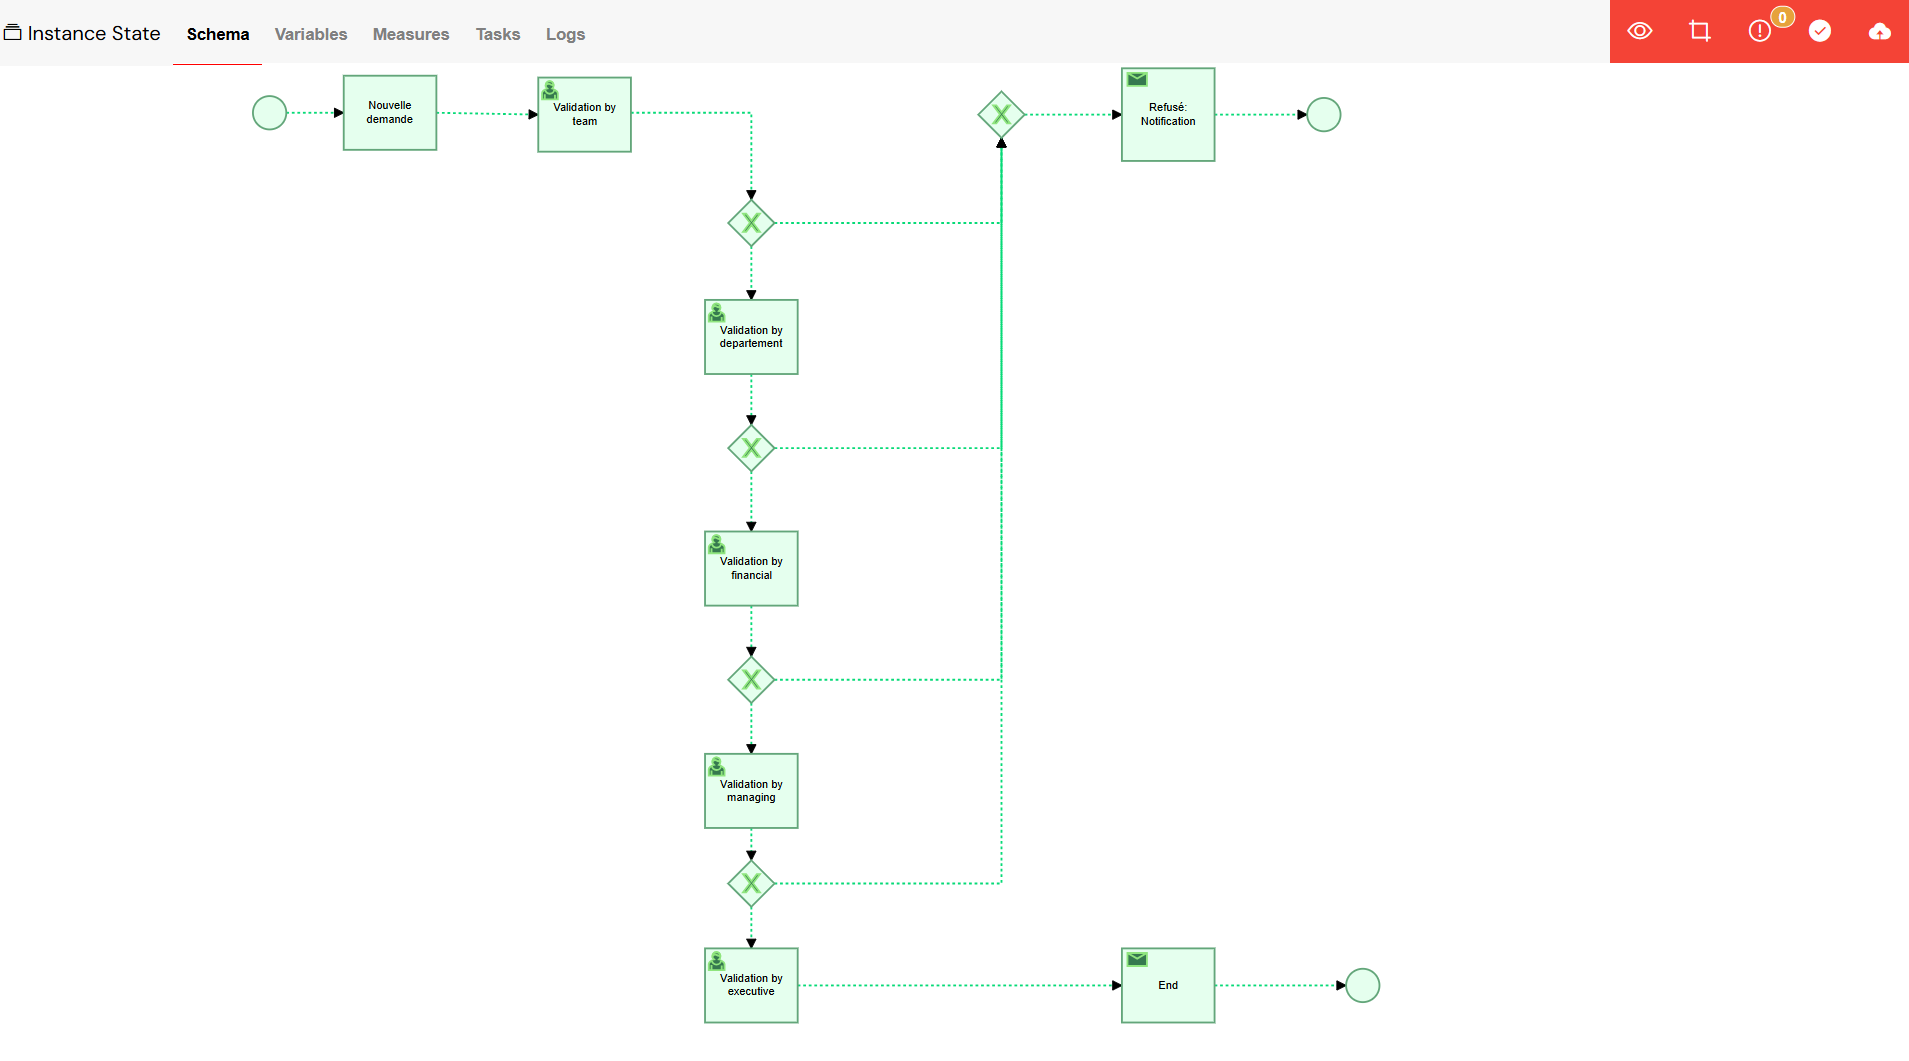
Schema View
- Visual Process Flow: See the BPMN diagram with activity status
- Activity Highlighting: Running activities are highlighted in orange, completed in green, errors in red
- Click Interactions: Click on activities to see detailed information
Variables View
- Instance Variables: View and edit process variables
- Variable Types: Handle strings, numbers, dates, arrays, and objects
- Add Variables: Create new variables during execution
Measures View
- Performance Metrics: View calculated measures
- Add Measures: Create new performance indicators
- Edit Values: Modify measure values as needed
 View](/img/02_developpement_guide/07-monitor-run/measures_view.png)
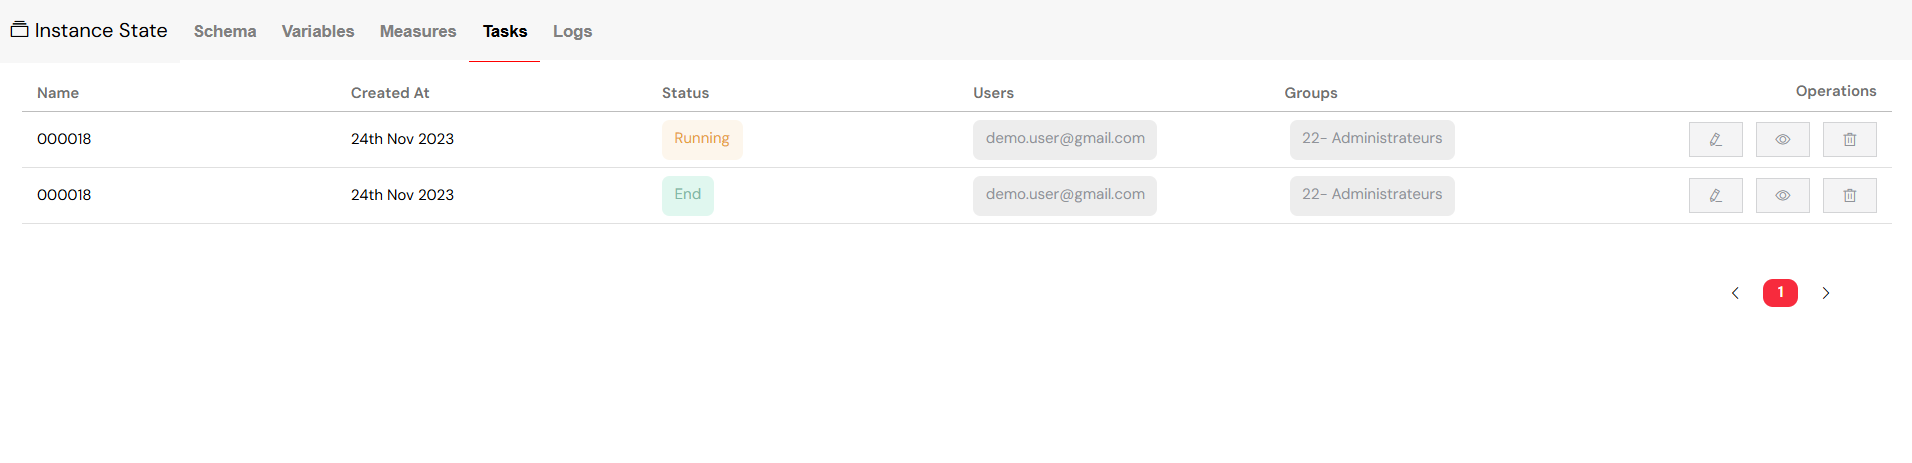
Tasks View
- Task List: All tasks associated with the instance
- Task Details: Creation date, status, and assignments
- Task Actions: Edit, view, or delete individual tasks
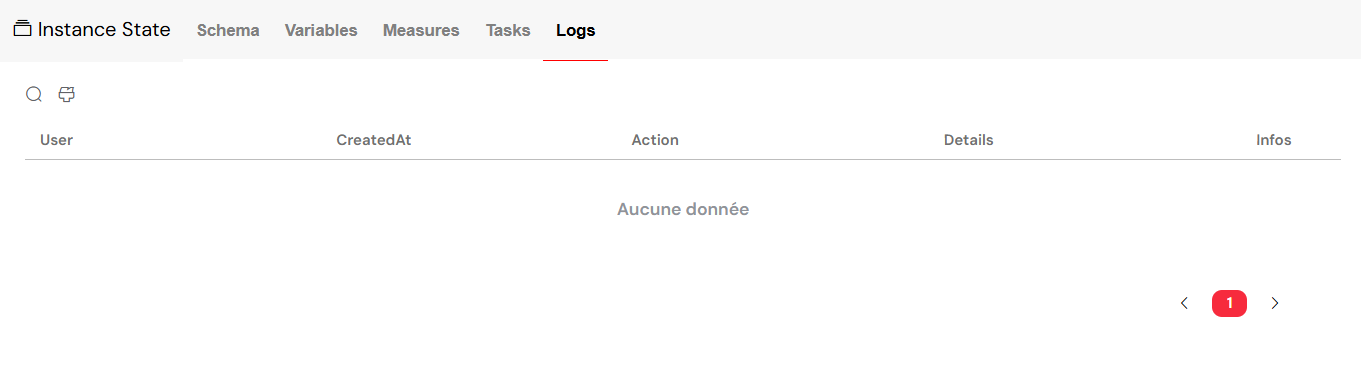
Logs View
- Activity Logs: Complete audit trail of instance activities
- User Actions: Track who performed what actions
- Search Logs: Filter logs by user, date, action type, or details
- Export Options: Access detailed log information
Sub-processes View
- Child Instances: View related sub-process instances
- Navigation: Jump to sub-process details
- Status Tracking: Monitor sub-process completion

Best Practices
Monitoring
- Regular Checks: Monitor the dashboard regularly for errors
- Set Up Notifications: Configure error notifications for proactive management
- Use Filters: Leverage filtering to focus on specific processes or issues
Task Management
- Clear Assignments: Ensure tasks are properly assigned to users or groups
- Monitor Workload: Track task distribution across team members
- Update Assignments: Modify assignments as team availability changes
Error Handling
- Quick Response: Address errors promptly to prevent process delays
- Root Cause Analysis: Use logs to understand error causes
- Process Improvement: Update processes based on error patterns
Performance
- Environment Separation: Use appropriate environments (TEST/UAT/PROD)
- Resource Monitoring: Track instance counts and performance
- Cleanup: Regularly end completed instances to maintain performance
The Monitor & Run page is essential for maintaining operational excellence in your Softyflow environment, providing the tools needed to ensure smooth process execution and quick issue resolution.
Next Steps
Now that you understand monitoring and runtime management, explore advanced topics:
- Reporting - Create reports and dashboards from your process data
- Integration - Monitor external integrations and API performance
- Database Integration - Monitor database performance and connections
- Test & Deploy - Optimize your deployment pipeline based on production insights
For administration and security, review:
- User Management - Manage user access and assignments
- Role Management - Configure role-based permissions
- System Logs - Advanced logging and audit trails
- Authentication - Security and access control
For performance optimization, explore our video tutorials and learn about process measures for tracking KPIs.