Run & Instance Management
The Run section provides complete visibility and control over all process instances across your environments (Test, UAT, Prod). From high-level monitoring to detailed instance management, you can track execution status, debug issues, and manage instance lifecycles in real-time.
This comprehensive monitoring system integrates with user management, role management, mail notifications, and system logs to provide complete operational oversight.
To access it: Go to Monitoring > Run from the top navigation menu.
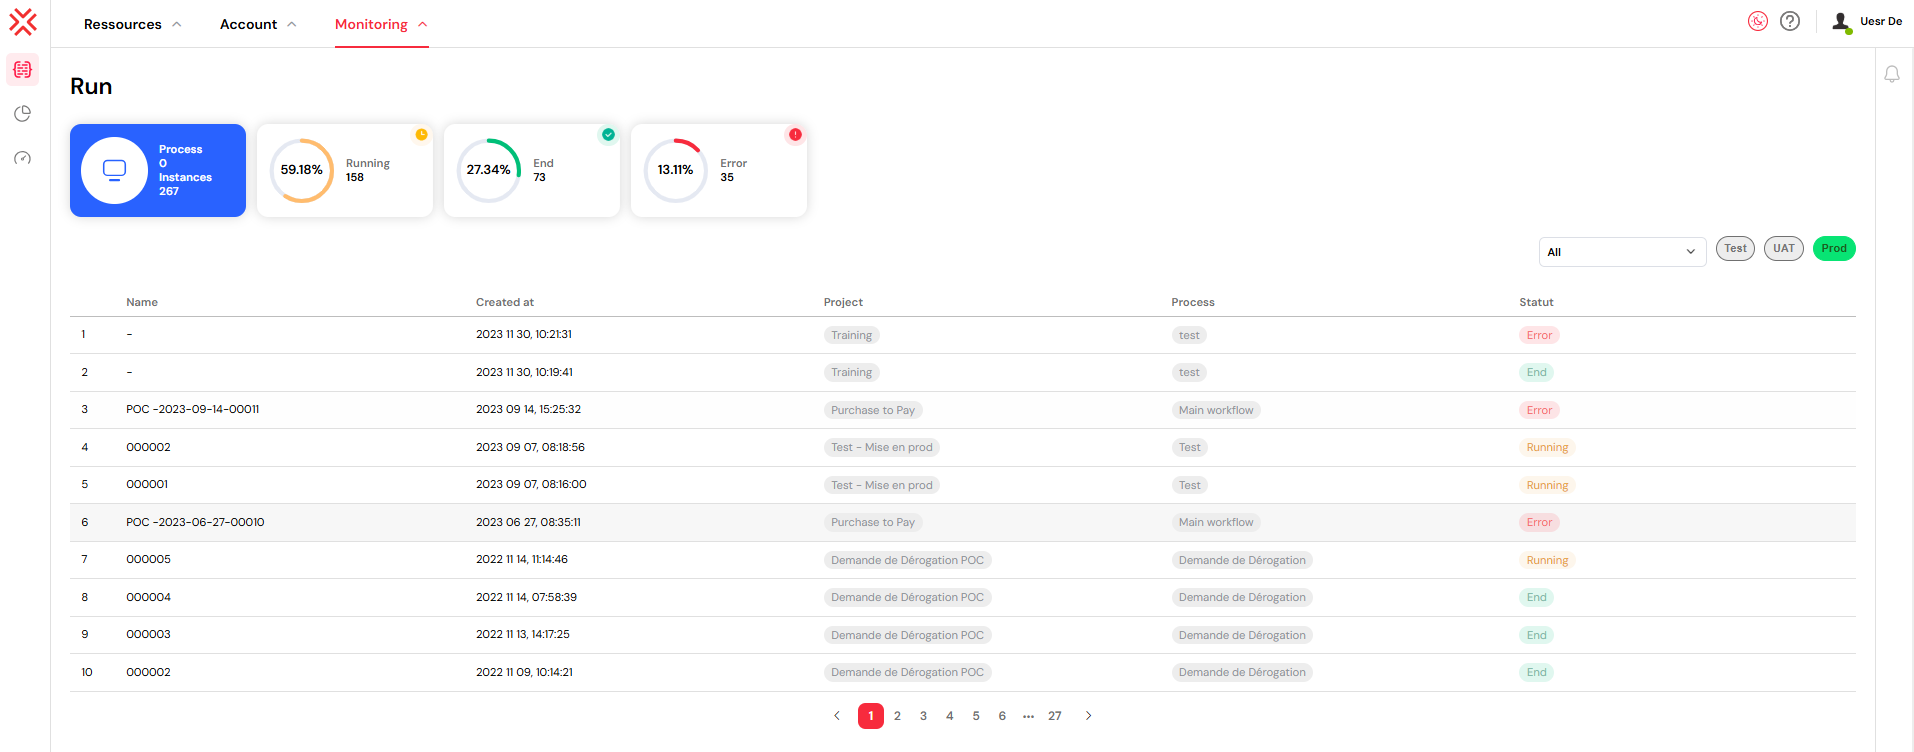
1. Instance Monitoring Dashboard
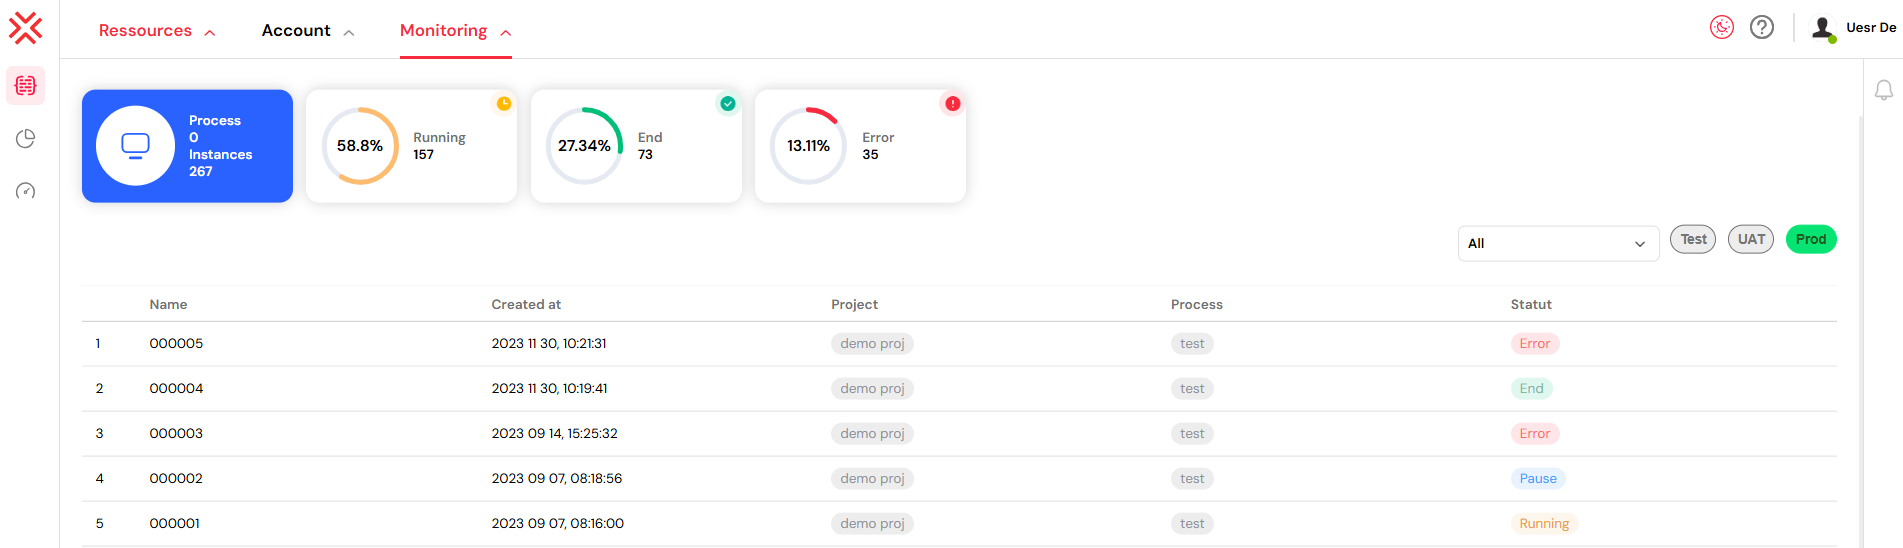
Statistics Overview
The main dashboard provides instant insights into your process execution:
- Process & Instance Counts: Total number of processes and launched instances
- Status Distribution: Visual breakdown of instances by status:
- Running: Currently active and executing steps
- End: Successfully completed instances
- Error: Failed instances requiring attention
Each status card shows both absolute numbers and percentage distribution with progress indicators.
Interactive Filtering
Click on any status card to automatically filter the instance list by that status.
2. Instance List & Filtering
Filter Controls
- Status Filter: Select from dropdown (All, Running, End, Error)
- Environment Filter: Switch between Test, UAT, and Prod environments using color-coded buttons matching your deployment strategy:
- Test: Yellow indicator
- UAT: Blue indicator
- Prod: Green indicator
Instance Table
Each instance row displays:
- Index: Sequential numbering
- Name: Instance identifier
- Created At: Launch date and time
- Project: Associated project with color-coded tag
- Process: Process name with tag
- Status: Current execution status with color coding
Navigation Actions
Click on table rows to navigate:
- Project column: Opens project builder in new tab
- Process column: Opens process builder with specific process
- Other columns: Opens instance details interface
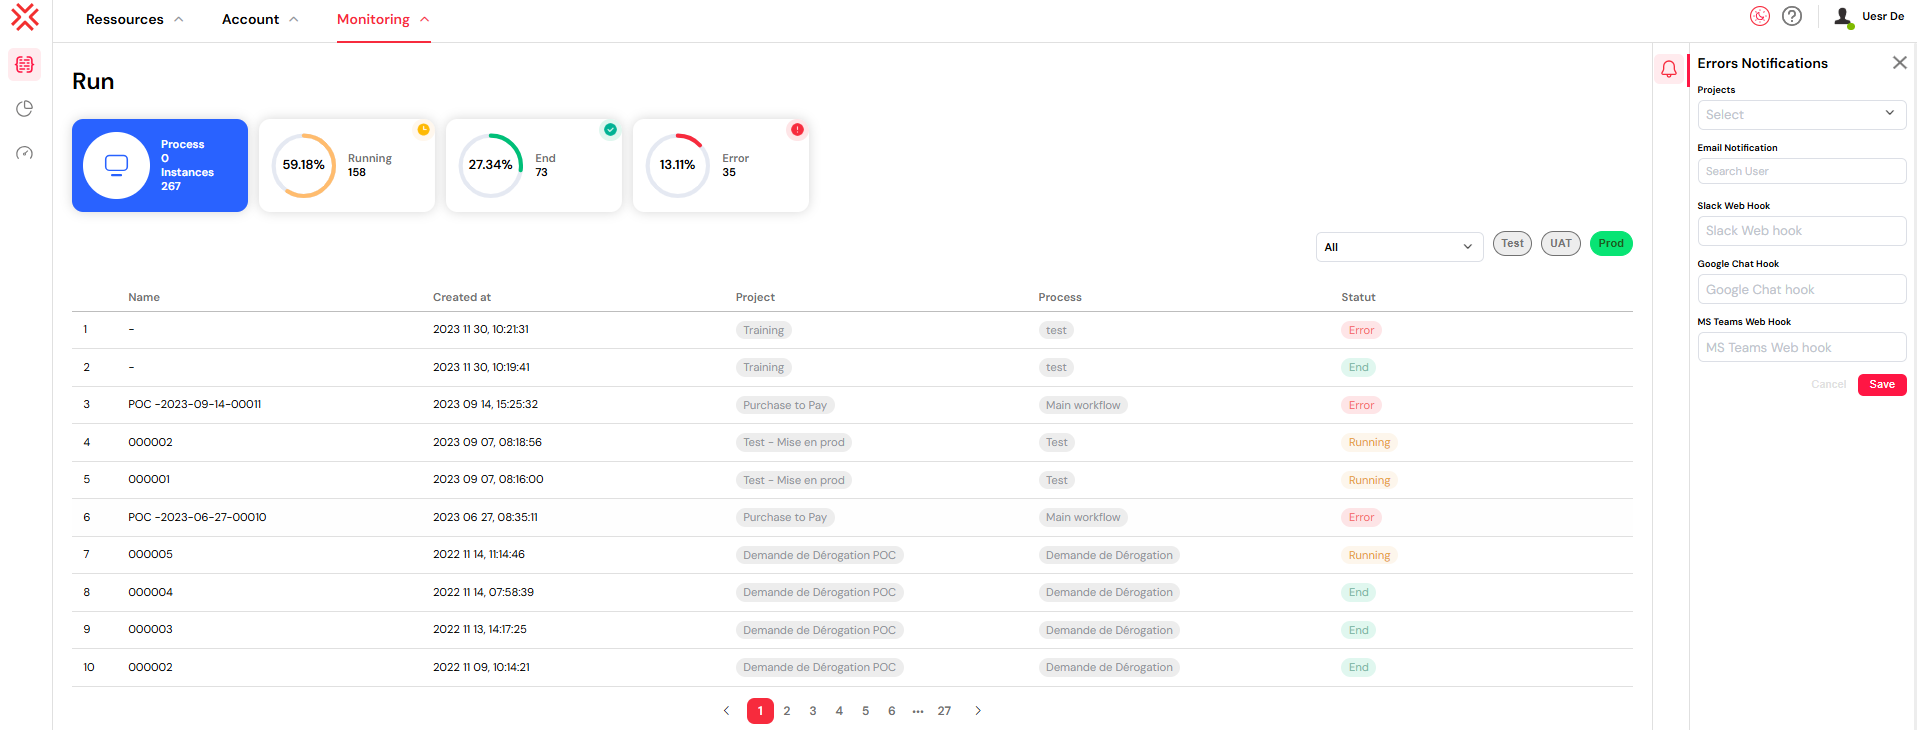
3. Error Notification Configuration
Configure automated alerts for process failures to integrate with your mail management system:
Setup Process
- Click the notification icon in the right panel
- Configure notification channels:
- Projects: Select which projects to monitor
- Email Notification: Add recipient email addresses using configured mail providers
- Slack Web Hook: Configure Slack integration
- Google Chat Hook: Set up Google Chat notifications
- MS Teams Web Hook: Configure Microsoft Teams alerts
Benefits
- Stay informed about recurrent failures
- Reduce response time to critical issues
- Customize notification scope per project
3.1 Setting Up Webhook Integrations
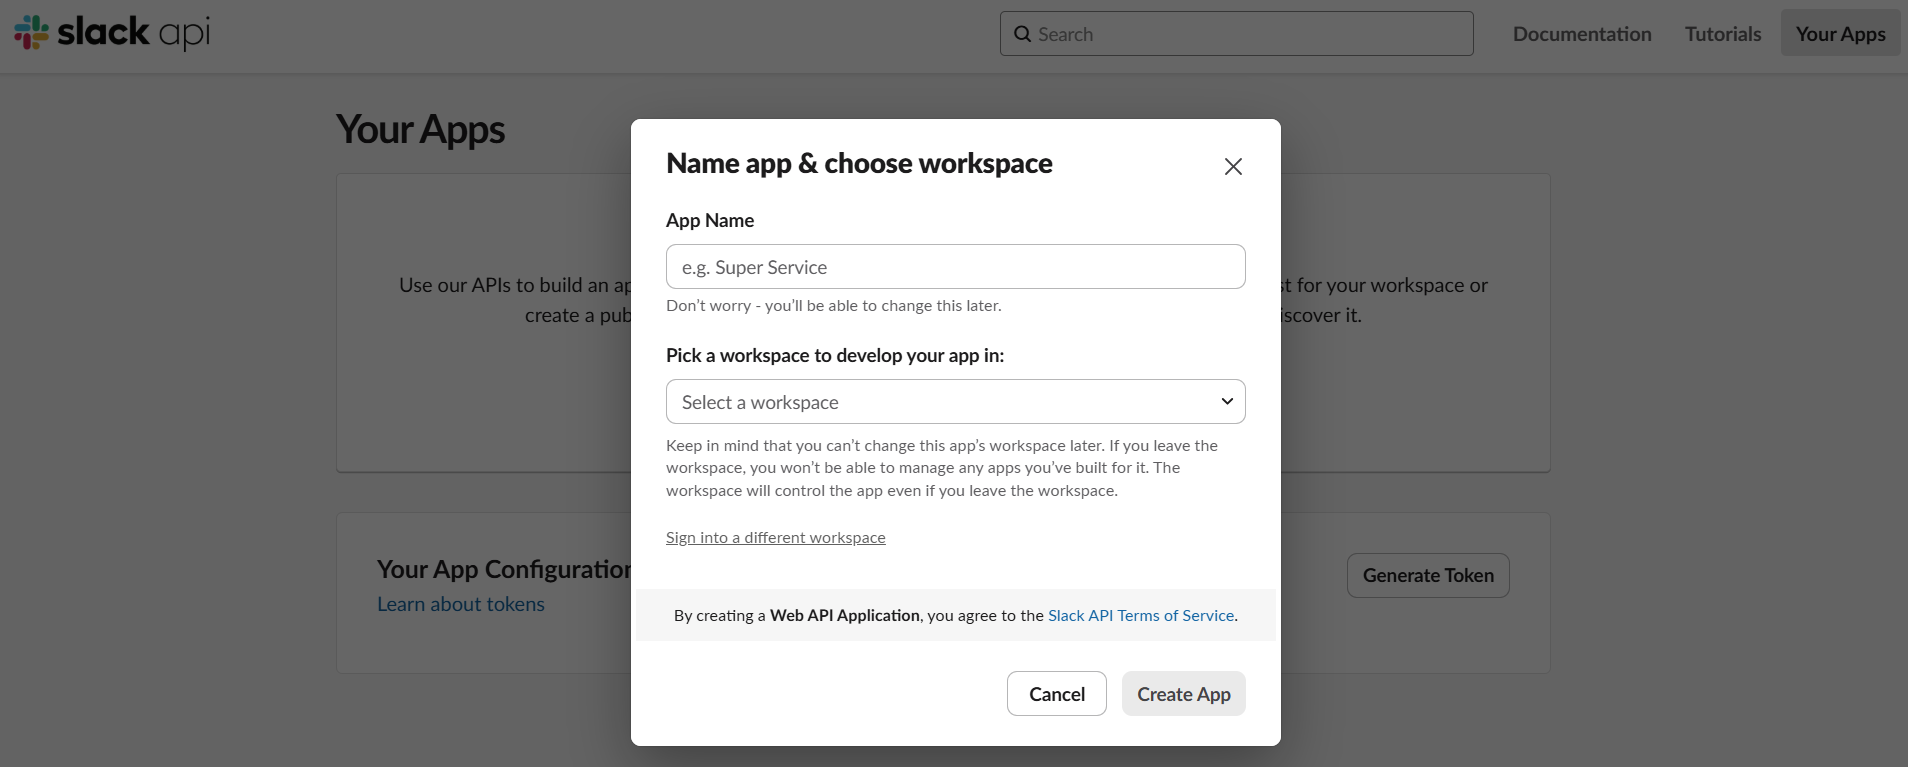
Slack Webhook Setup
- Create a Slack App:
- Go to https://api.slack.com/apps
- Click "Create New App" → "From scratch"
- Enter app name (e.g., "Softyflow Notifications") and select your workspace
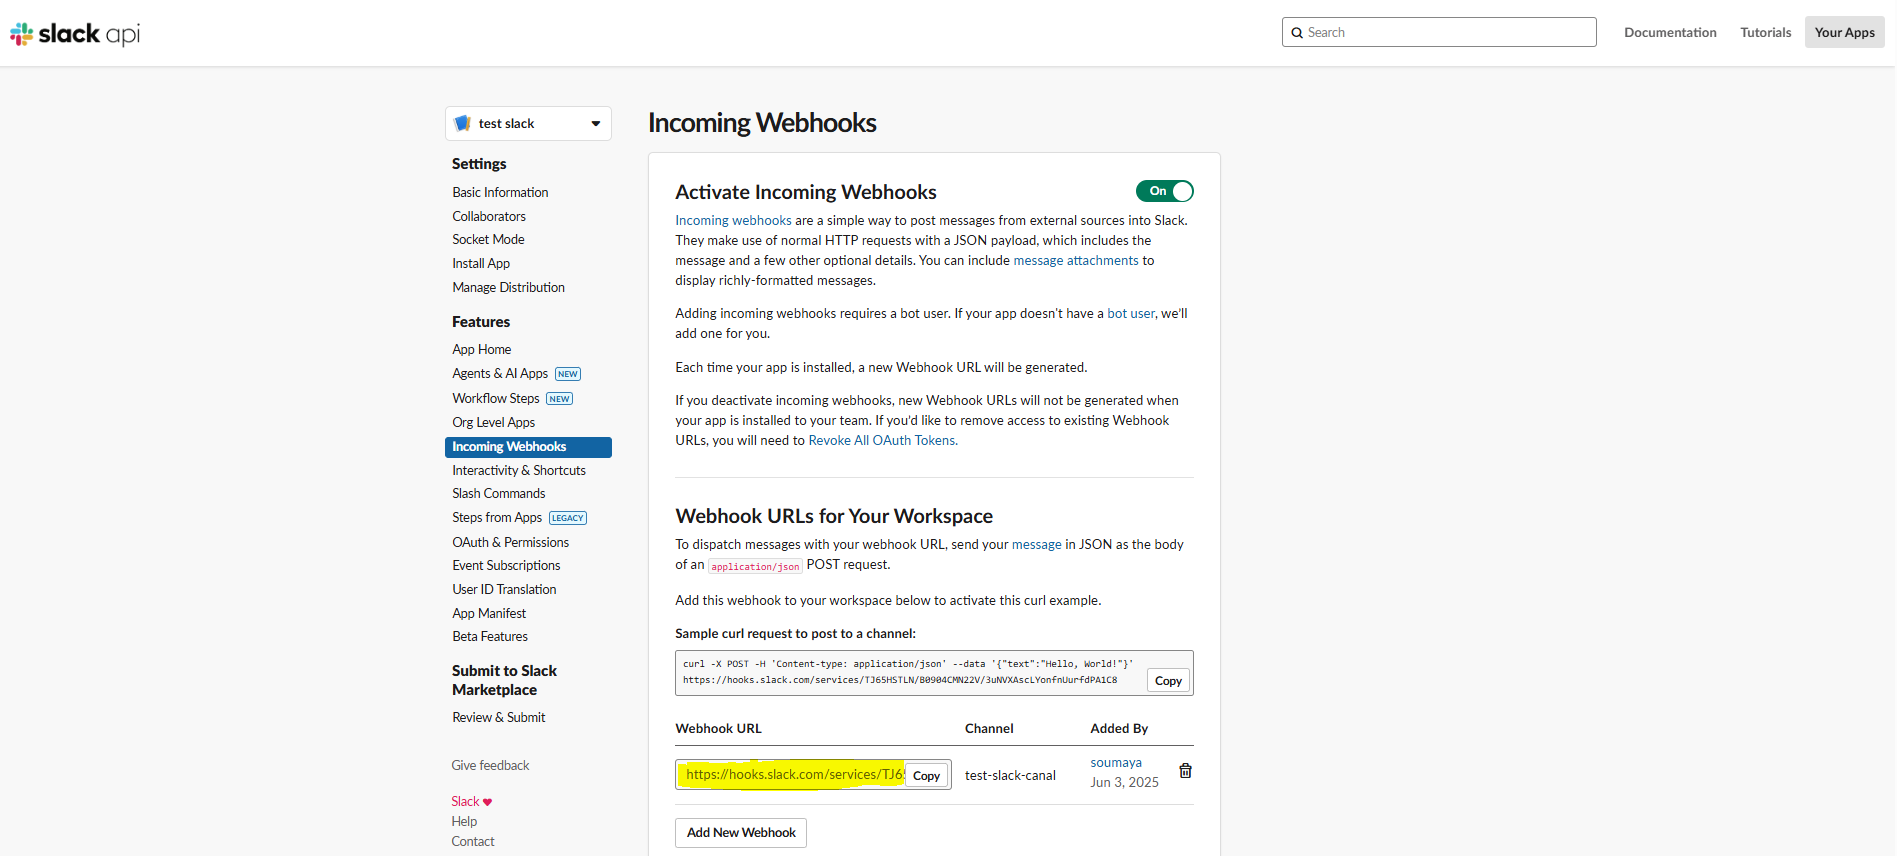
- Enable Incoming Webhooks:
- In your app settings, go to "Incoming Webhooks"
- Toggle "Activate Incoming Webhooks" to On
- Click "Add New Webhook to Workspace"
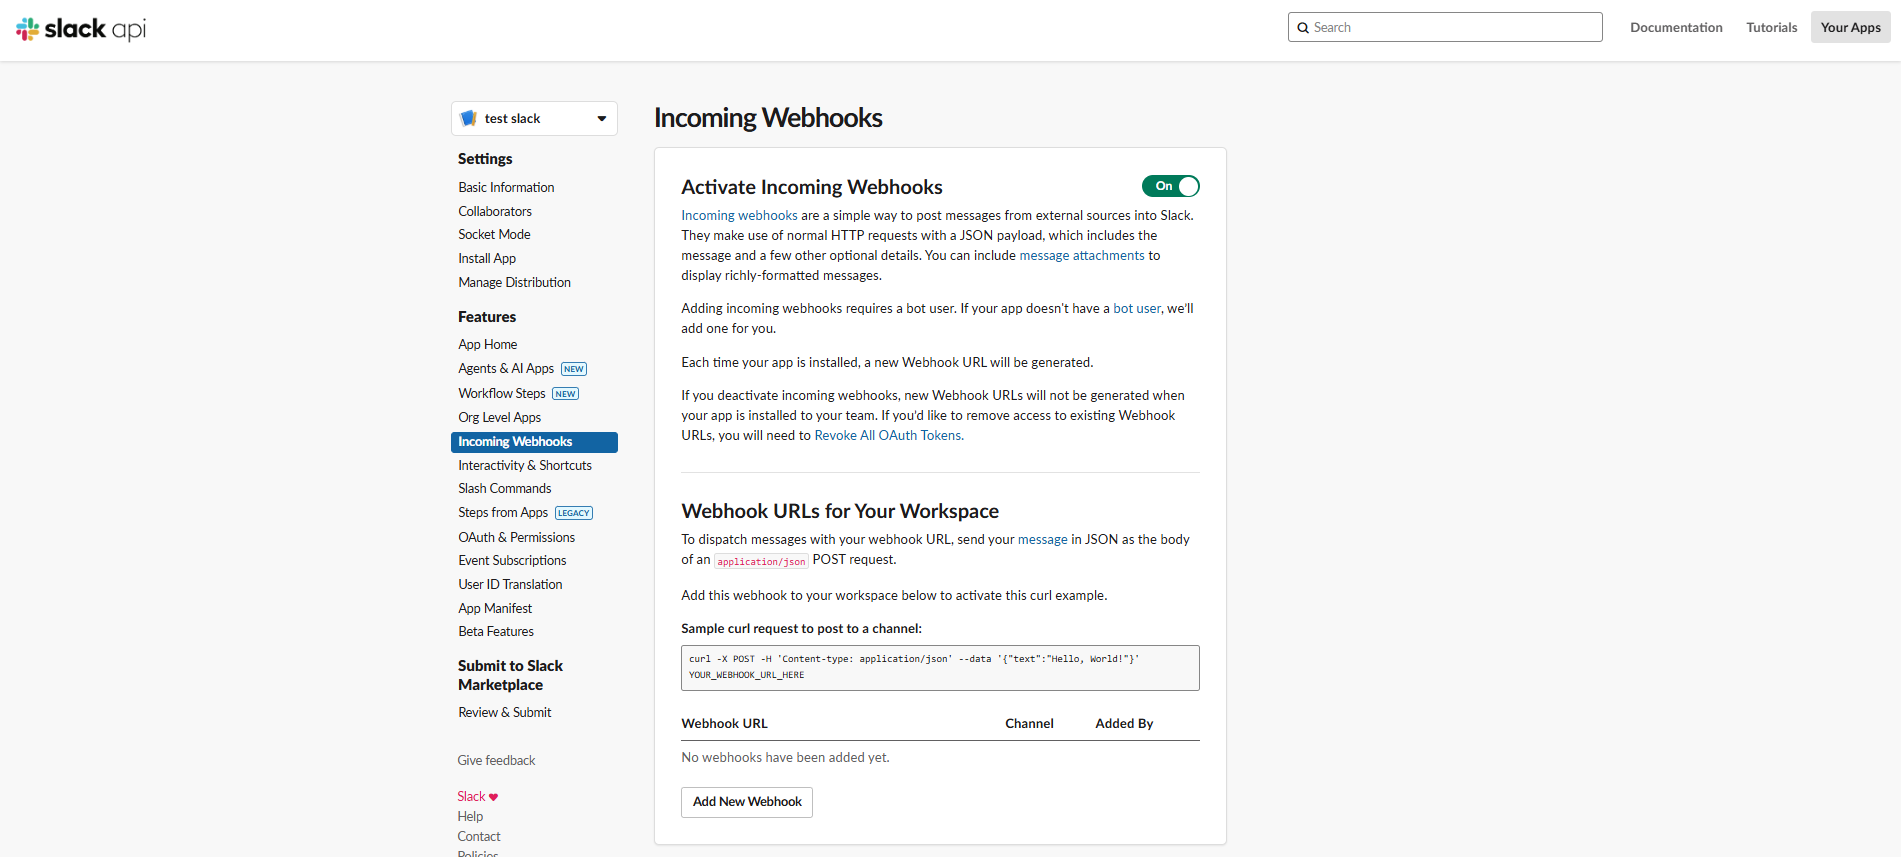
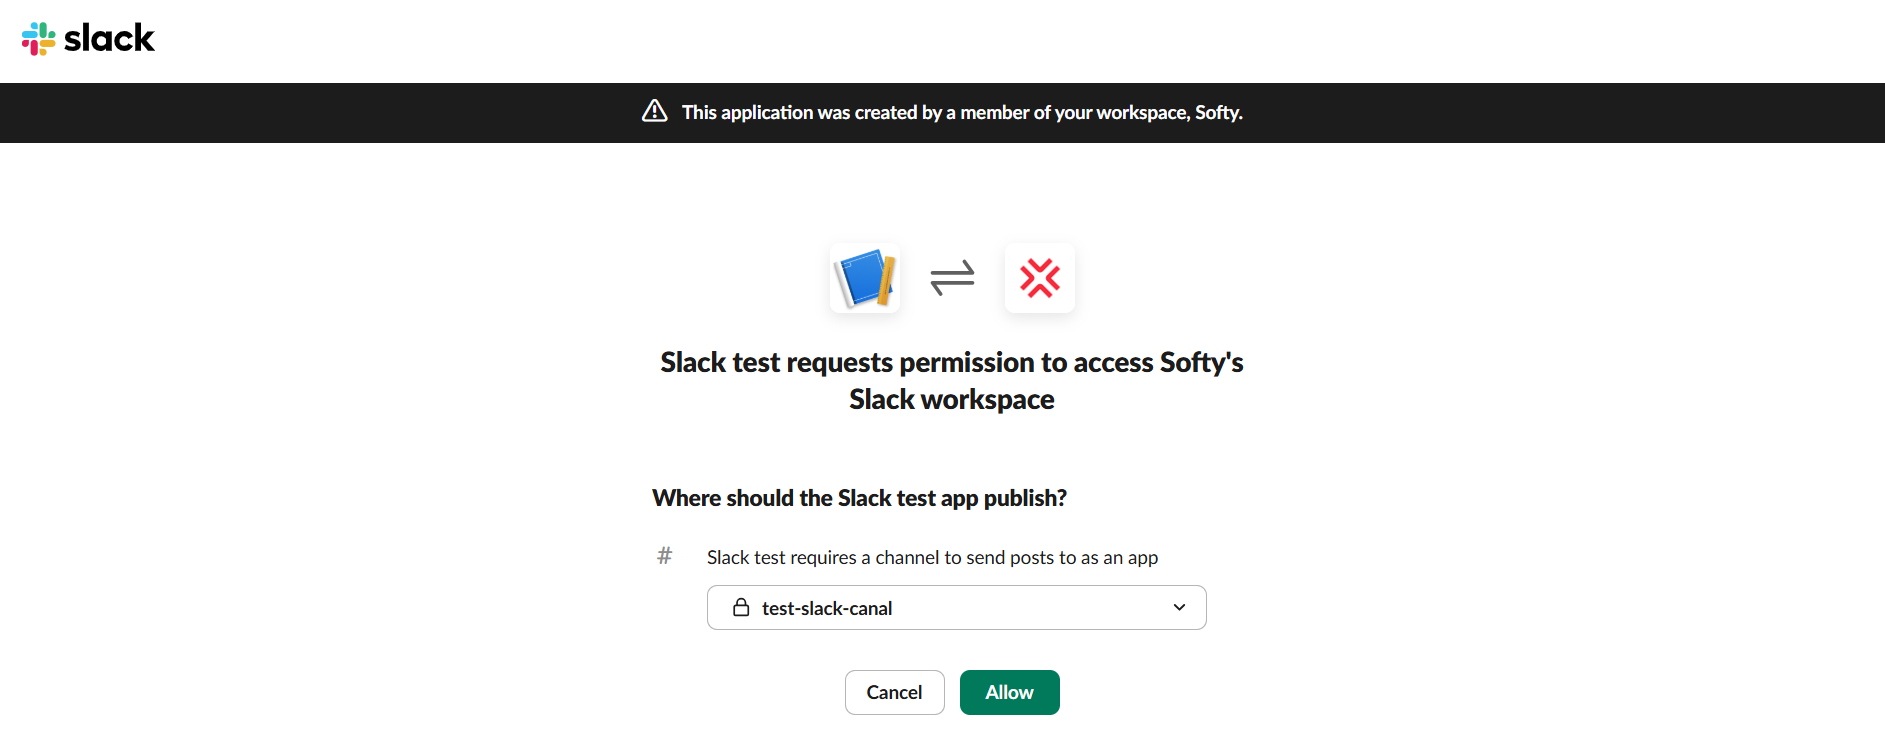
- Configure Channel:
- Select the channel where notifications should be sent
- Click "Allow" to authorize the webhook
- Copy Webhook URL:
- Copy the generated webhook URL (format:
https://hooks.slack.com/services/T00000000/B00000000/XXXXXXXXXXXXXXXXXXXXXXXX)
- Copy the generated webhook URL (format:
- Paste this URL in the "Slack Web Hook" field in Softyflow
Example Slack Webhook URL format:
https://hooks.slack.com/services/T1234567890/B1234567890/abcdefghijklmnopqrstuvwx
Google Chat Webhook Setup
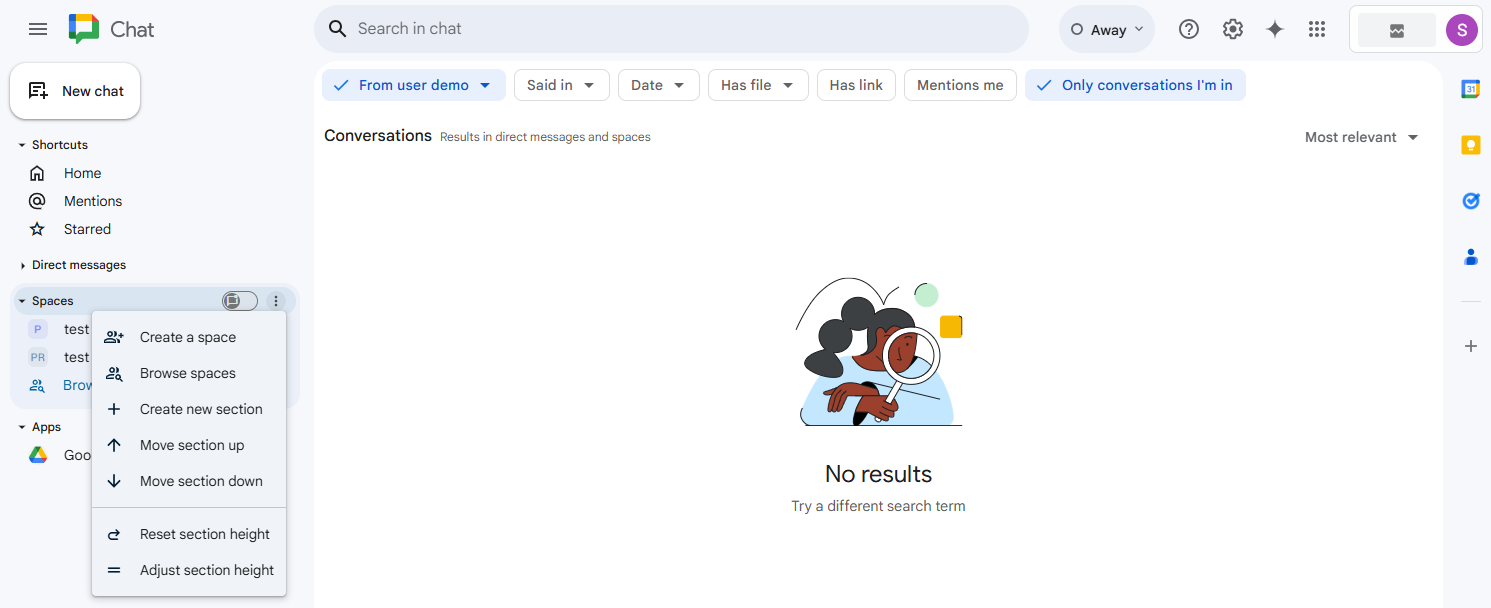
- Open Google Chat:
- Navigate to the Google Chat space where you want notifications
- If you don't have a space, create one by clicking "+ Create space"
- Configure Webhooks:
- In the chat space, click on the space name at the top
- Select "Apps & integrations"
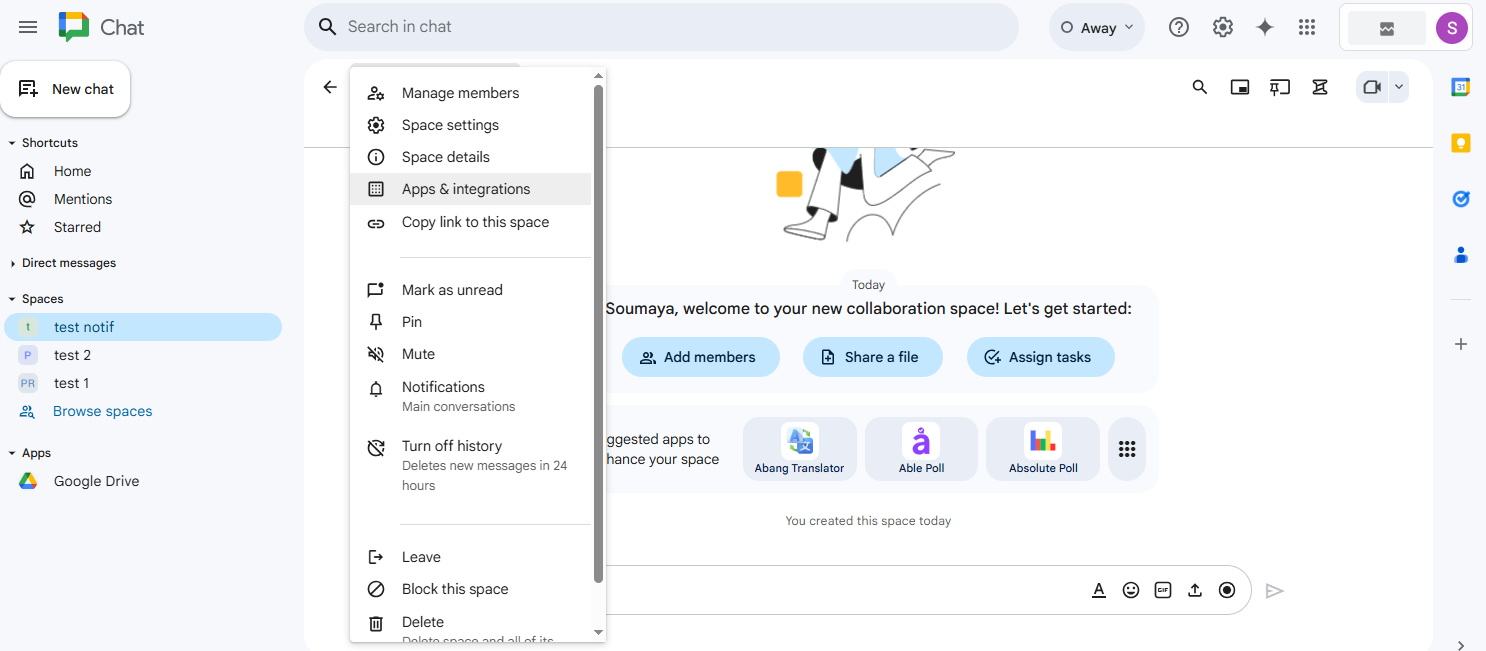
- Click "Add webhooks"
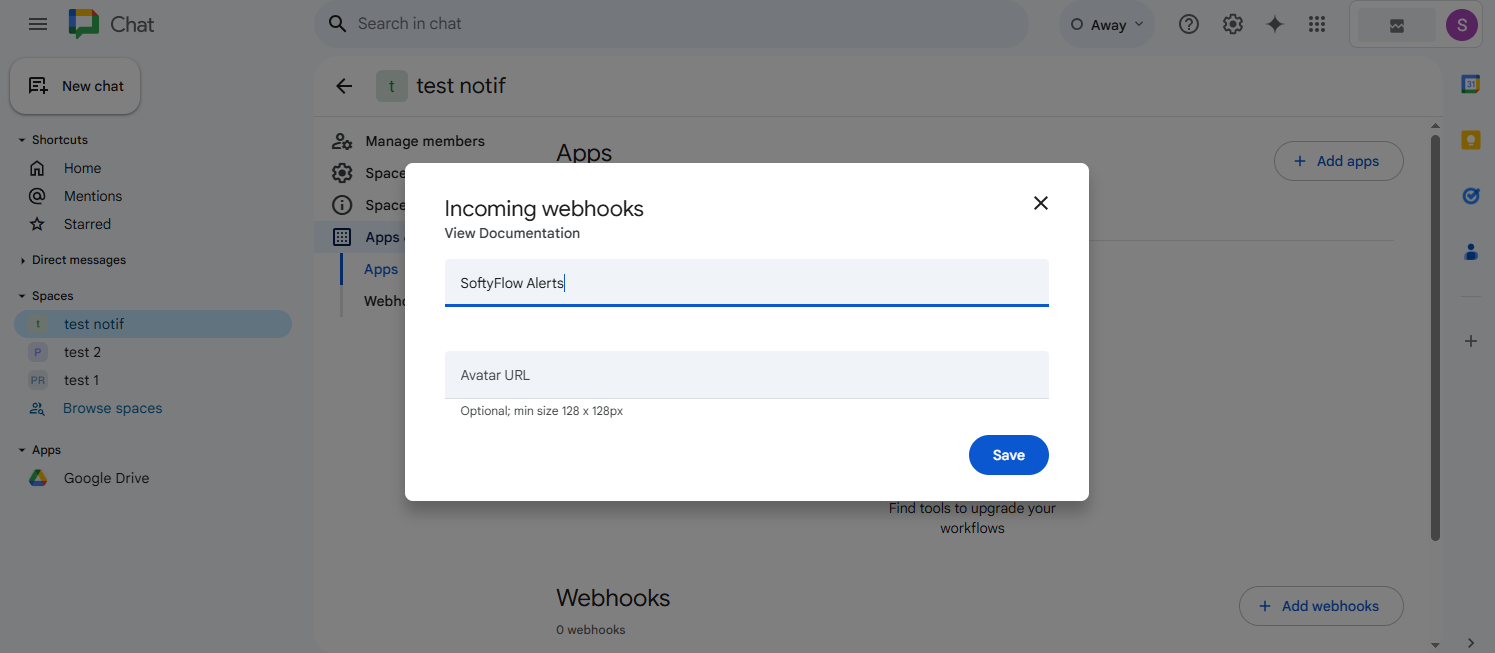
- Create Webhook:
- Enter webhook name (e.g., "Softyflow Alerts")
- Optionally add an avatar URL for the webhook
- Click "Save"
- Copy Webhook URL:
- Copy the generated webhook URL (format:
https://chat.googleapis.com/v1/spaces/XXXXXXX/messages?key=YYYYYYY&token=ZZZZZZZ)
- Copy the generated webhook URL (format:
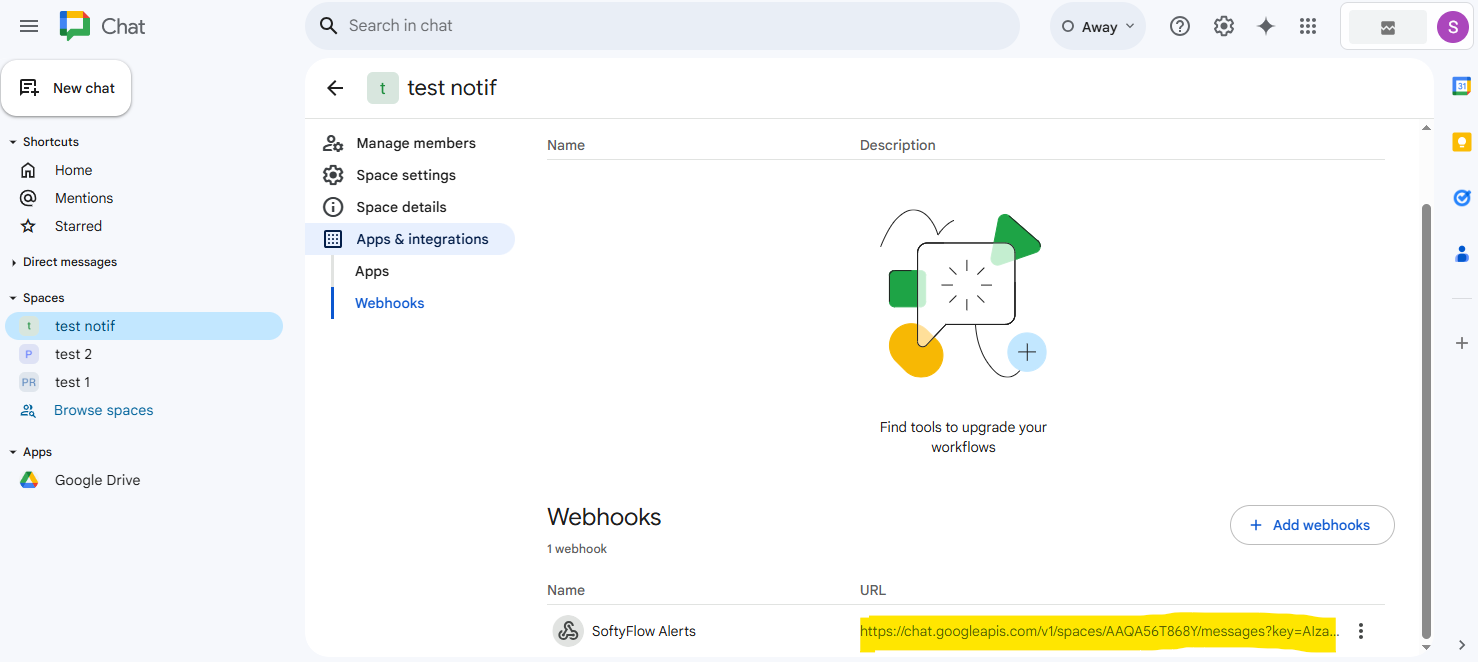
- Paste this URL in the "Google Chat Hook" field in Softyflow
Example Google Chat Webhook URL format:
https://chat.googleapis.com/v1/spaces/AAAABbbbCCCc/messages?key=AIzaSyDdI0hCZtE6vySjMm-WEfRq3CPzqKqqsHI&token=abcdefghijklmnopqrstuvwxyz123456789
Microsoft Teams Webhook Setup
- Open Microsoft Teams:
- Navigate to the Teams channel where you want notifications
- If you don't have a channel, create one or use an existing team
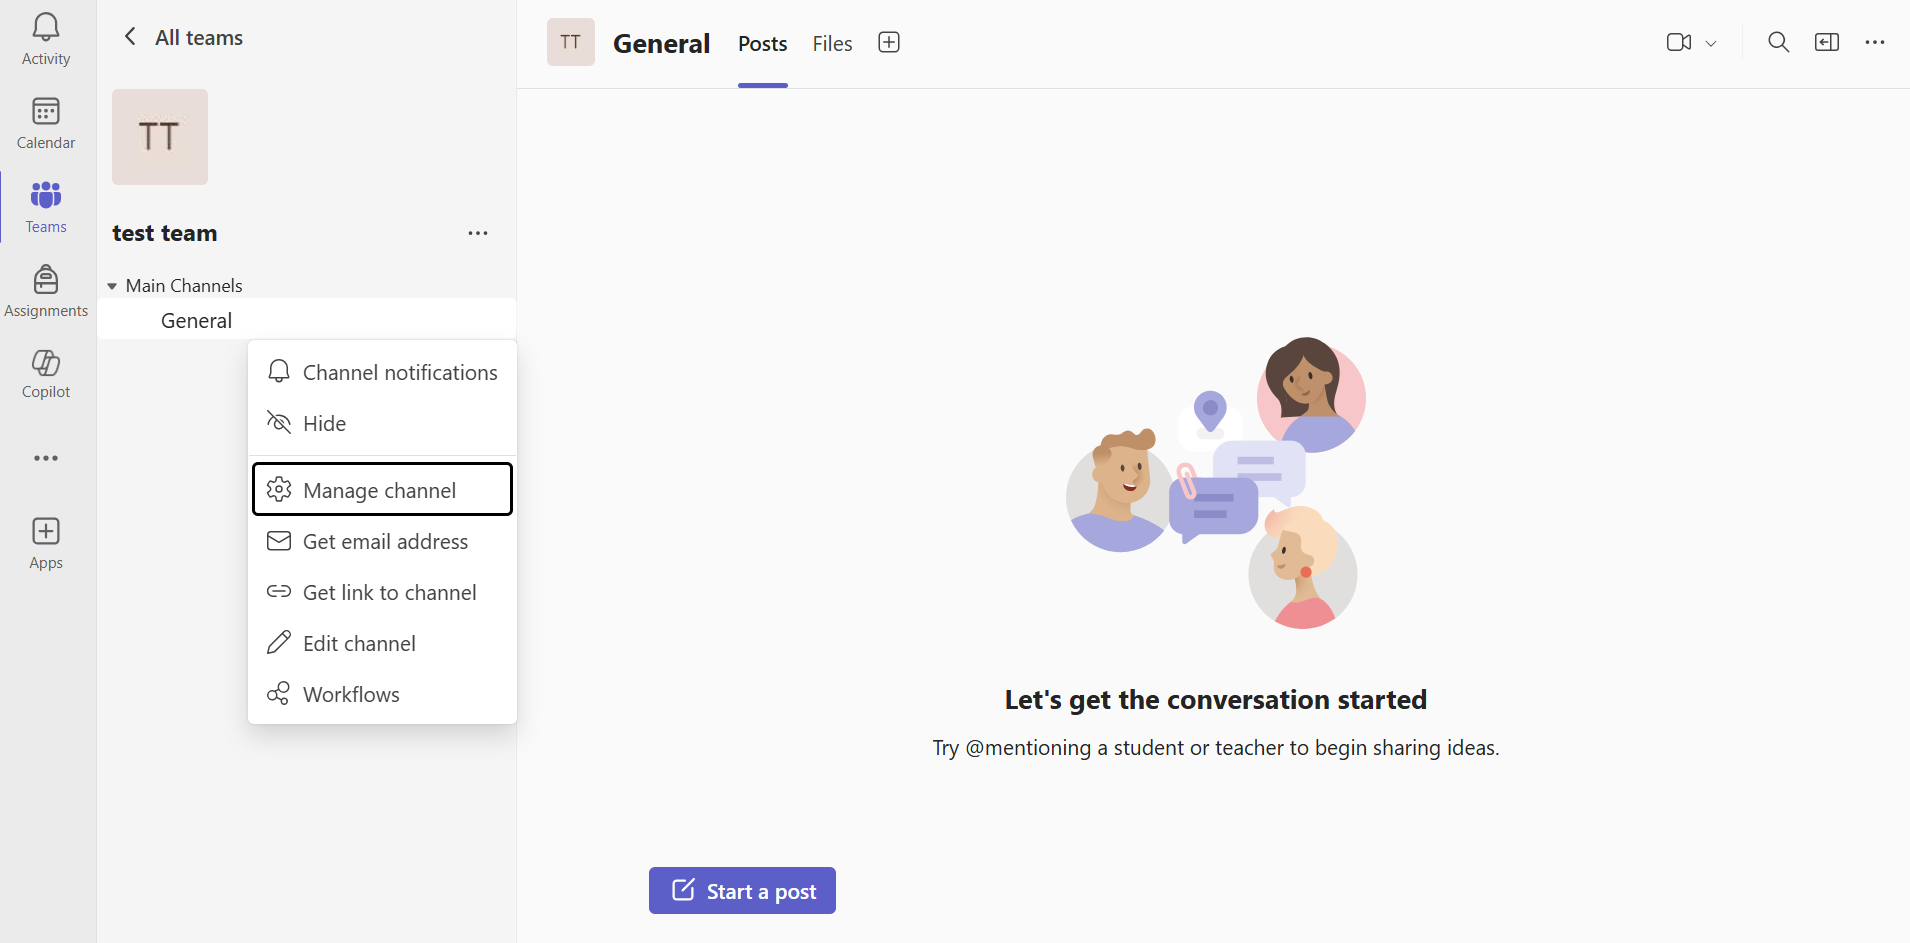
- Add Incoming Webhook Connector:
- Click on the "..." (more options) next to your channel name
- Select "Connectors"
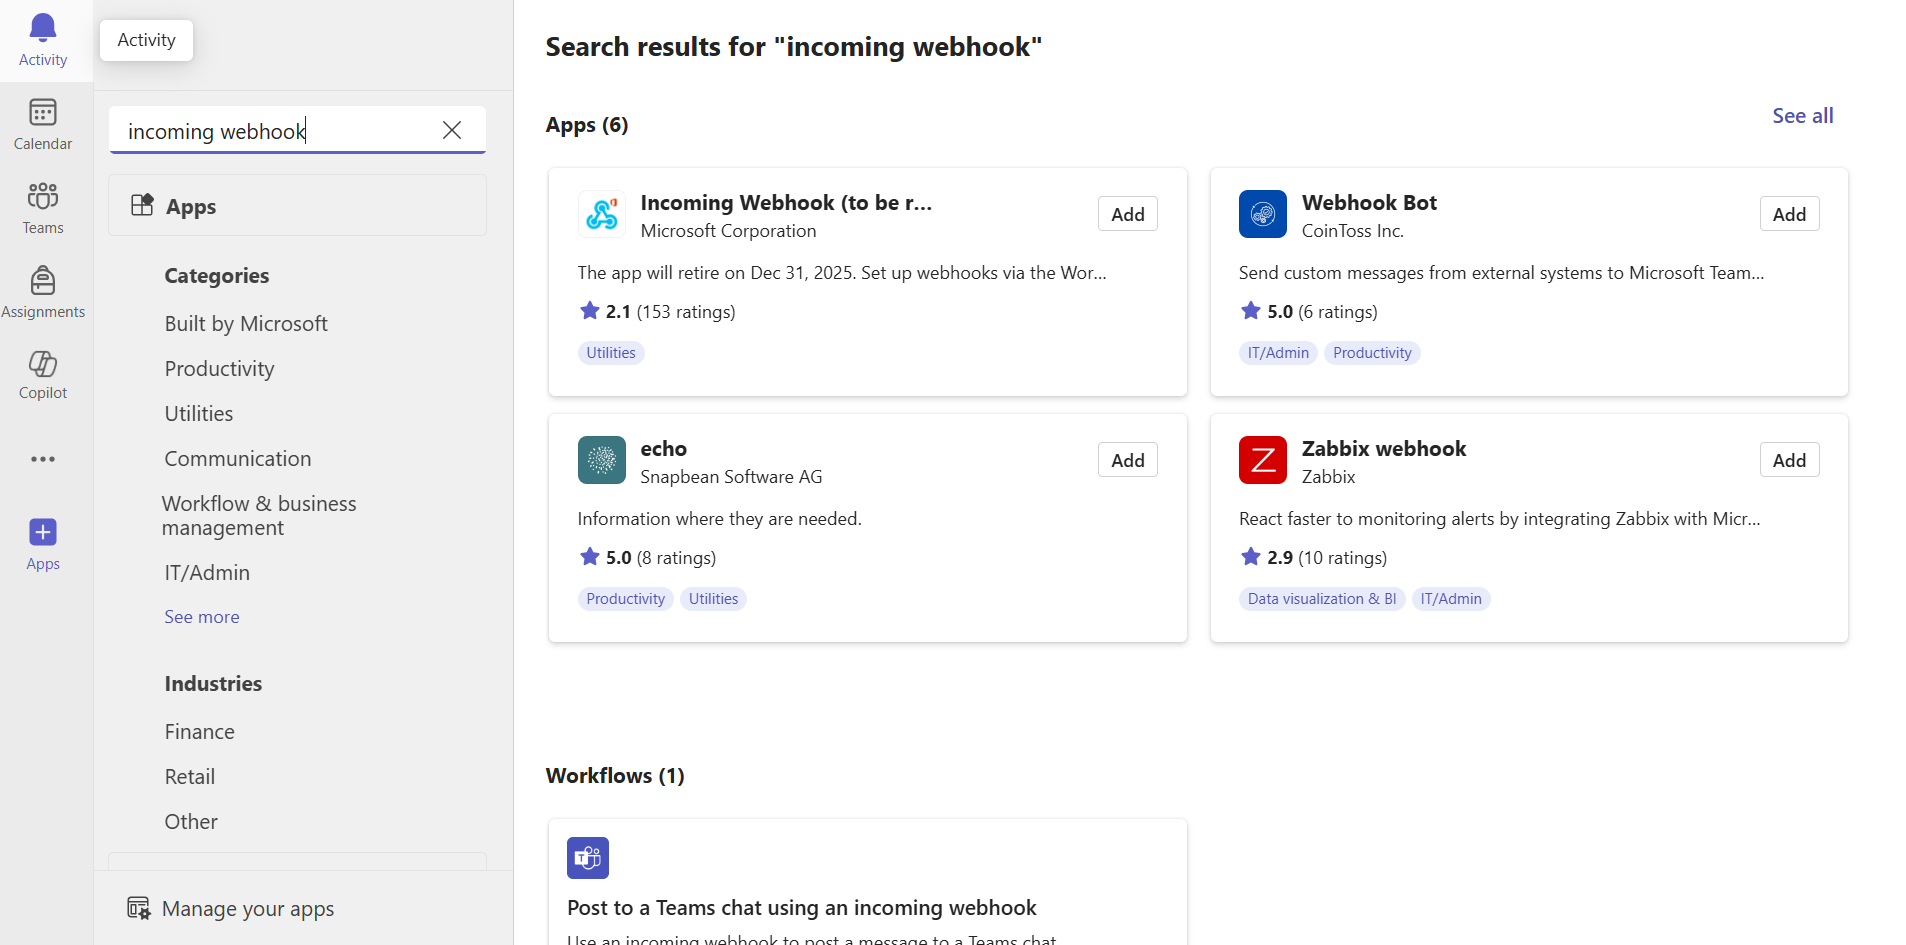
- Search for "Incoming Webhook" and click "Configure"
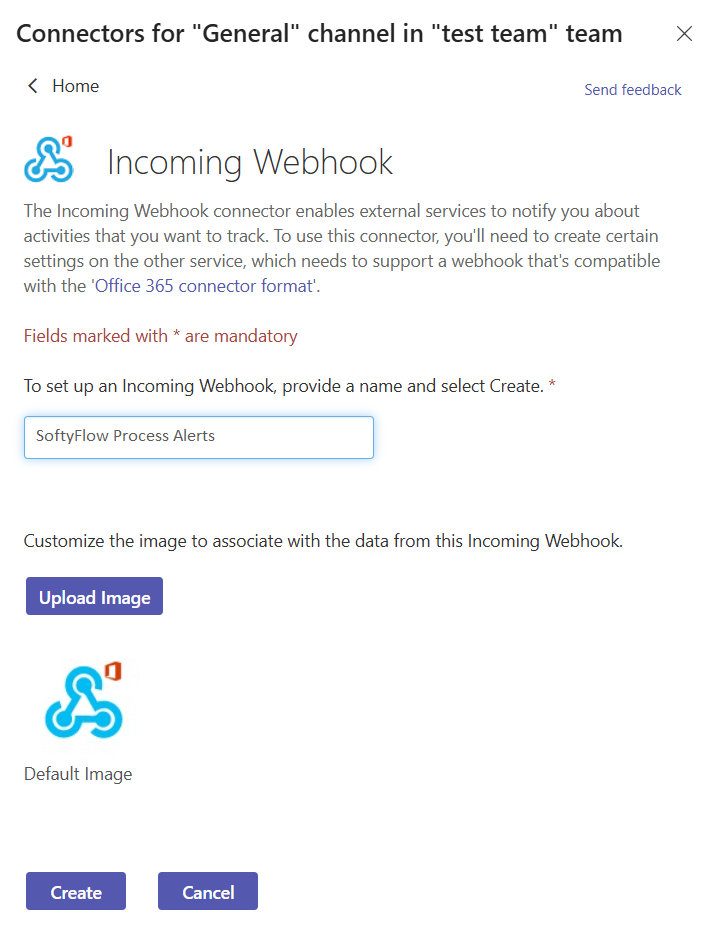
- Configure Webhook:
- Enter a name for the webhook (e.g., "Softyflow Process Alerts")
- Optionally upload an image for the webhook
- Click "Create"
- Copy Webhook URL:
- Copy the generated webhook URL (format:
https://[tenant].webhook.office.com/webhookb2/[GUID]@[GUID]/IncomingWebhook/[GUID]/[GUID])
- Copy the generated webhook URL (format:
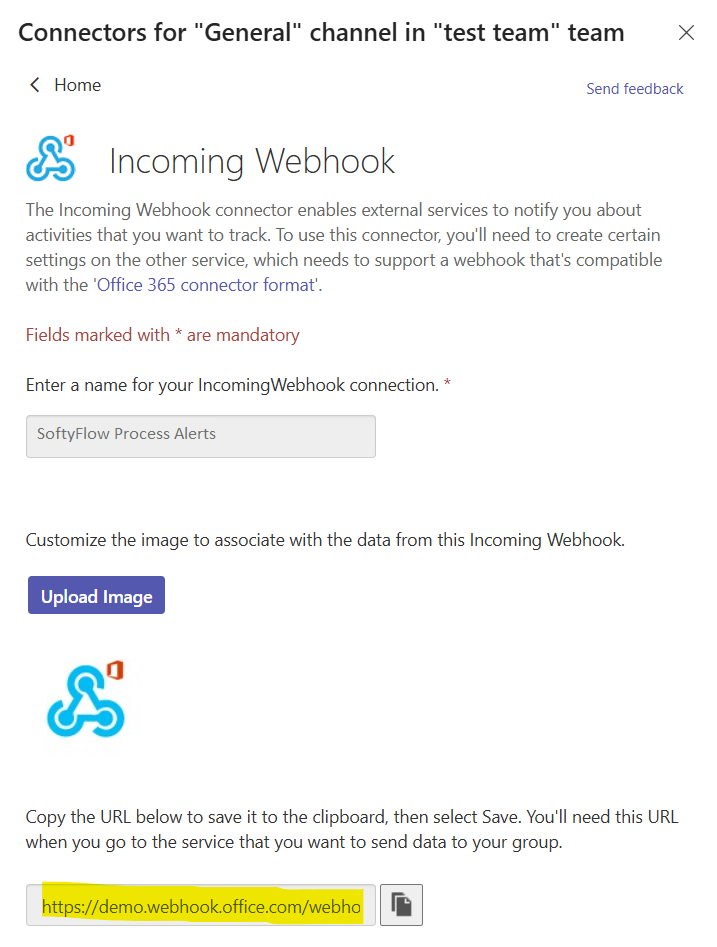
- Click "Done"
- Paste this URL in the "MS Teams Web Hook" field in Softyflow
Example MS Teams Webhook URL format:
https://yourtenant.webhook.office.com/webhookb2/12345678-1234-1234-1234-123456789012@12345678-1234-1234-1234-123456789012/IncomingWebhook/abcdefgh12345678/87654321-4321-4321-4321-210987654321
3.2 Webhook Security Best Practices
- URL Protection: Keep webhook URLs secure and don't share them publicly
- Regular Rotation: Periodically regenerate webhook URLs for security
- Team Access: Only provide webhook configuration access to authorized team members
- Testing: Test webhook configurations before deploying to production
3.3 Notification Message Format
Softyflow sends structured notifications containing:
- Instance Name: Failed process instance identifier
- Error Type: Classification of the error
- Timestamp: When the error occurred
- Project Information: Associated project details
- Direct Links: Quick access to instance details for troubleshooting
3.4 Troubleshooting Webhook Issues
Common Issues:
- Invalid URL: Ensure the webhook URL is copied correctly without extra characters
- Expired Webhooks: Some platforms may expire webhooks after inactivity
- Permission Issues: Verify the webhook has proper permissions to post messages
- Network Restrictions: Check if your organization's firewall allows outbound webhook connections
Testing Webhooks:
- Save your webhook configuration in Softyflow
- Manually trigger a test notification or wait for a process error
- Check the configured channel/space for the notification message
- If messages don't appear, verify the webhook URL and permissions
4. Performance Handling
Timeout Management
For large datasets that may take time to load:
- Automatic timeout detection
- Option to "Load Anyway" for comprehensive data
- Prevents browser freezing on large instance sets
5. Instance Details Management
Click on any instance to access comprehensive management tools across multiple views:
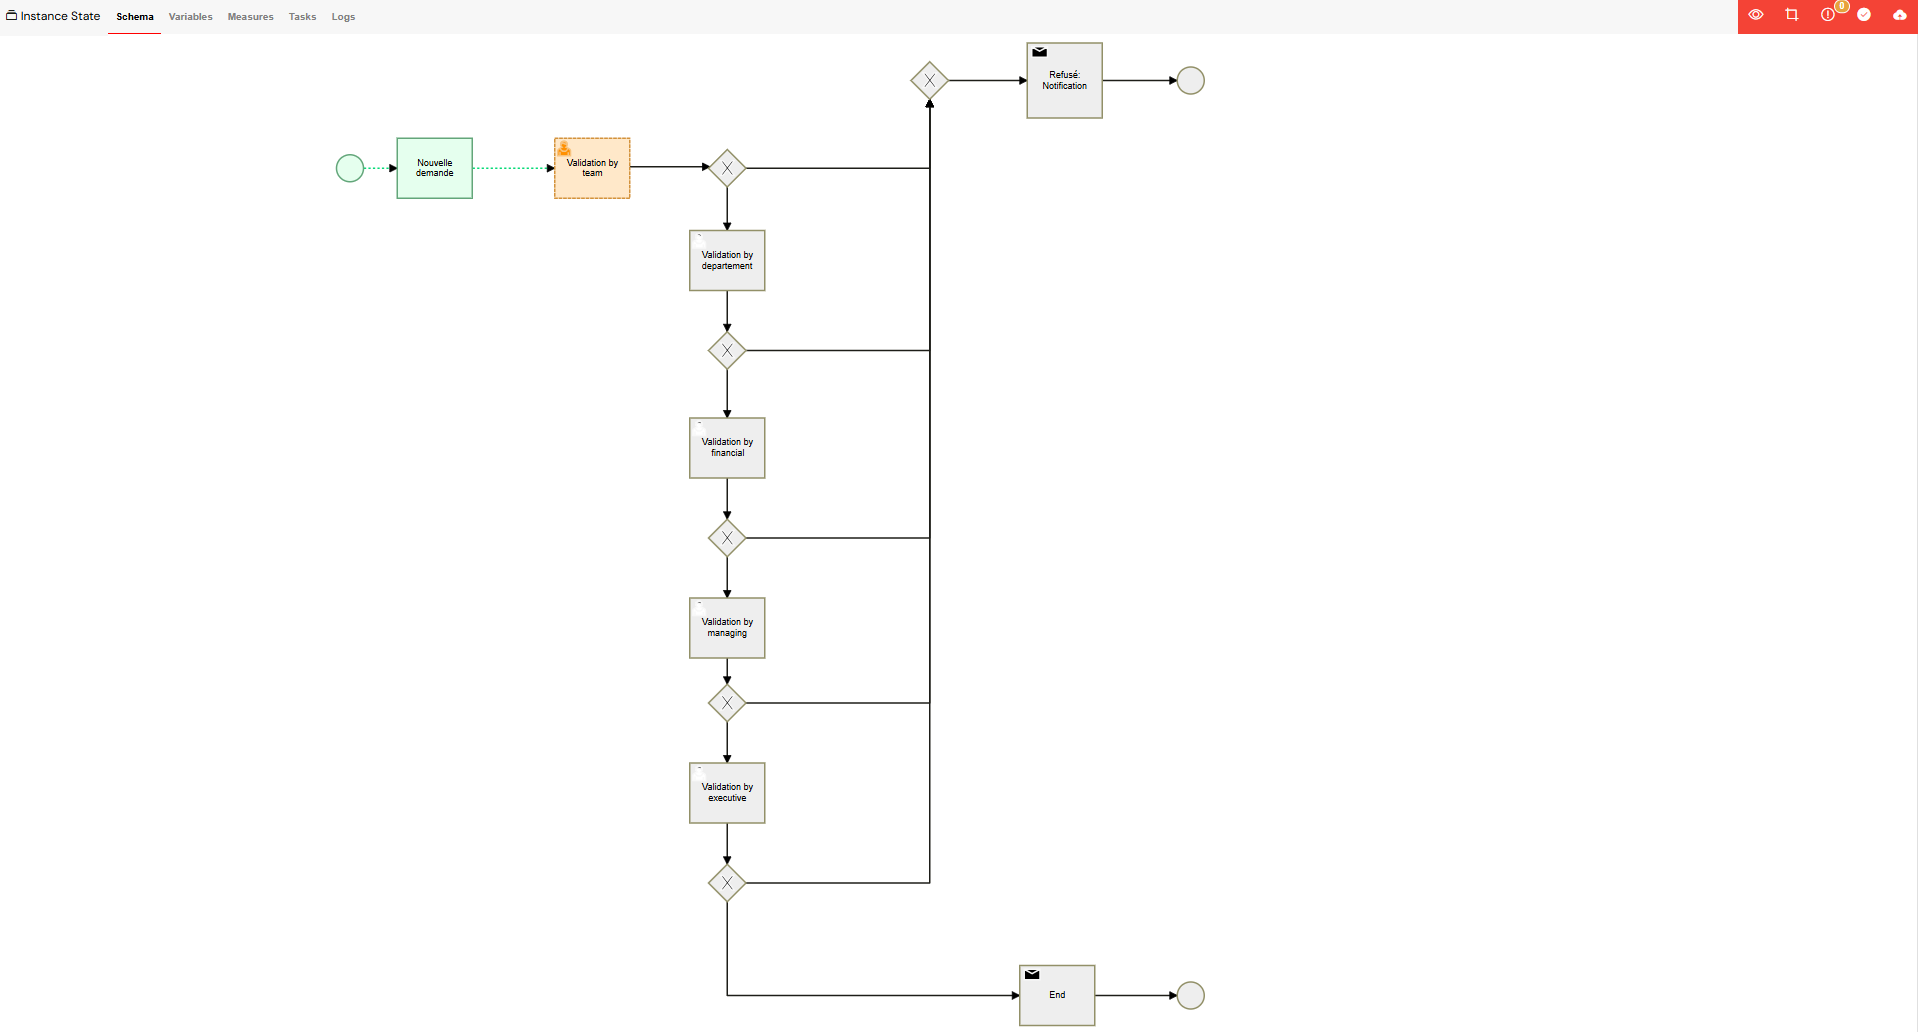
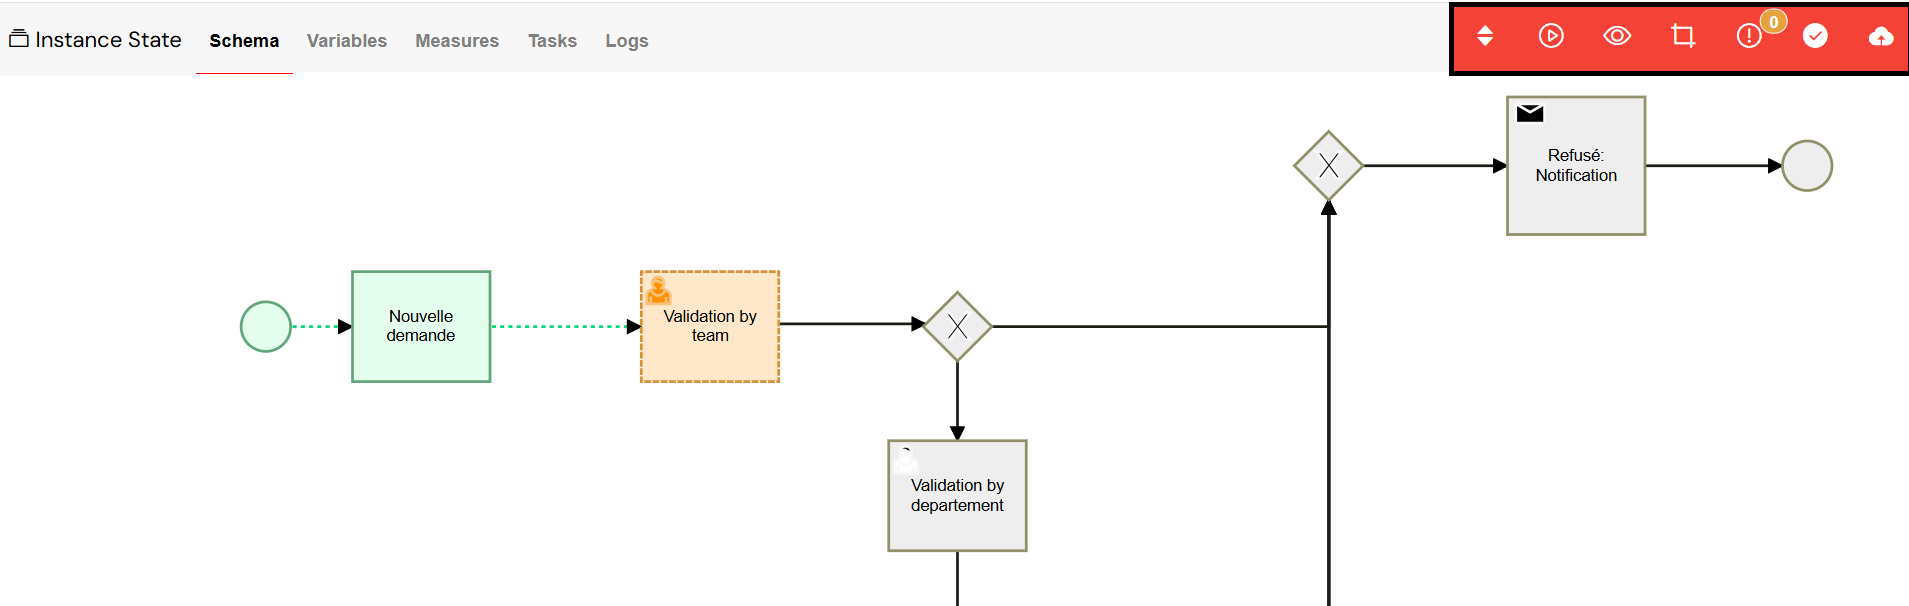
5.1 Schema View - Process Visualization
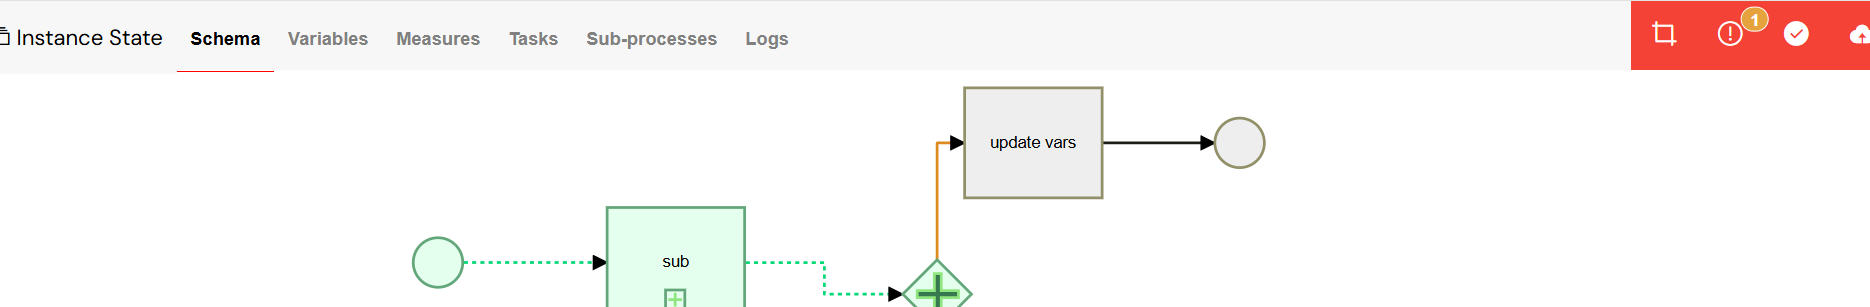
Visual Process Tracking
- Interactive BPMN diagram showing process flow
- Real-time activity status highlighting:
- Running: Orange with animated dashed border
- Completed: Green with solid highlighting
- Error: Red with error animation
- Default: Gray standard appearance
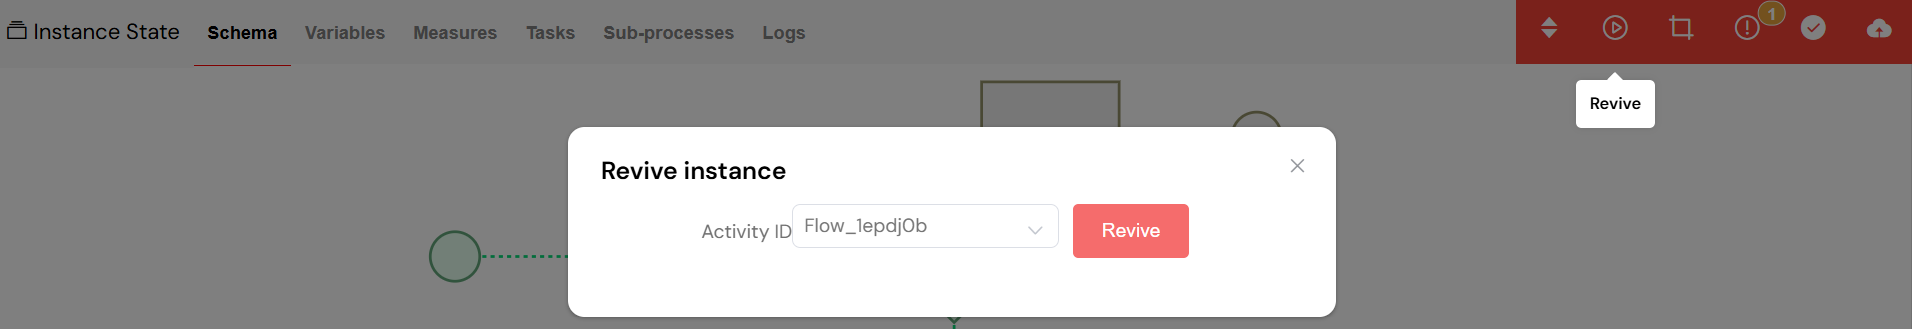
Instance Lifecycle Controls
- Switch Version: Update instance to different process version
- Revive: Resume paused instances from specific activities
- View Instance: Display the web interface associated with the open instance
- Edit Process: Open the process associated with the open instance
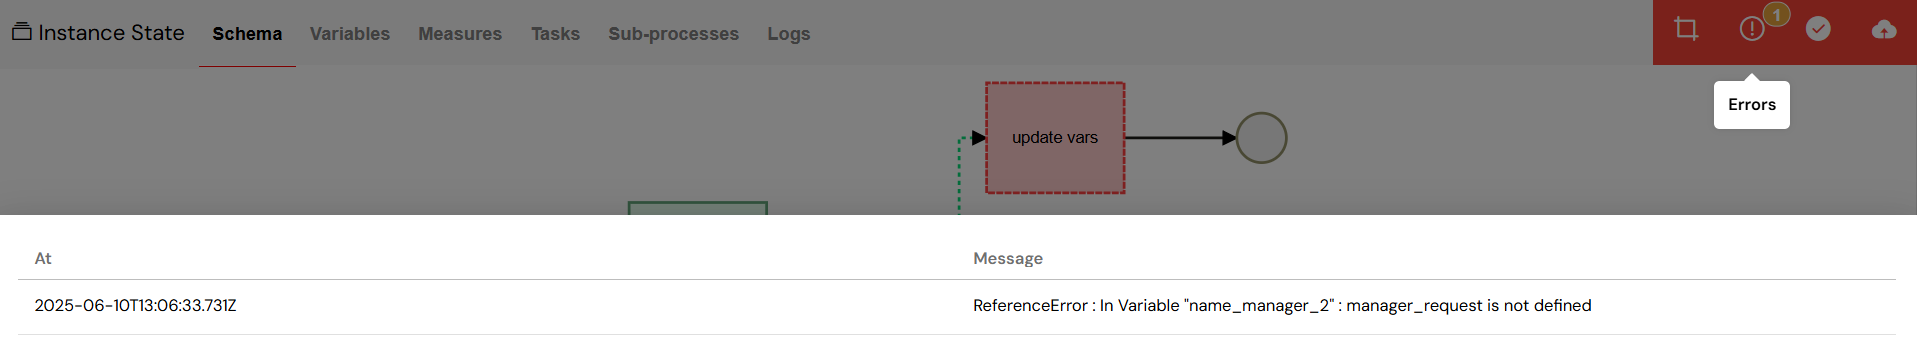
- Errors: Display the errors
- End Instance: Manually terminate execution (affects all related tasks)
- Save: Persist current instance state
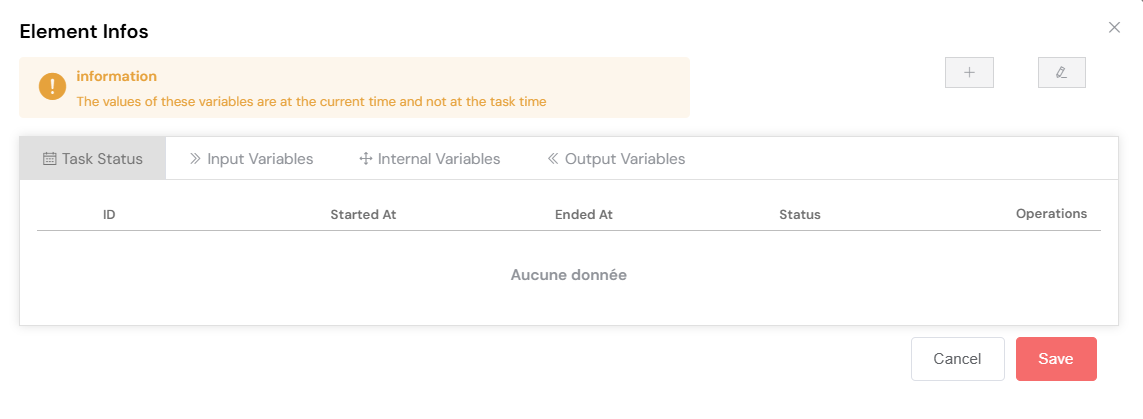
Activity Management
- Click any BPMN element to view detailed information
- Add new activities to running instances
- Edit activity status and properties
- Handle parallel gateway flows and branch variables
5.2 Variables Management
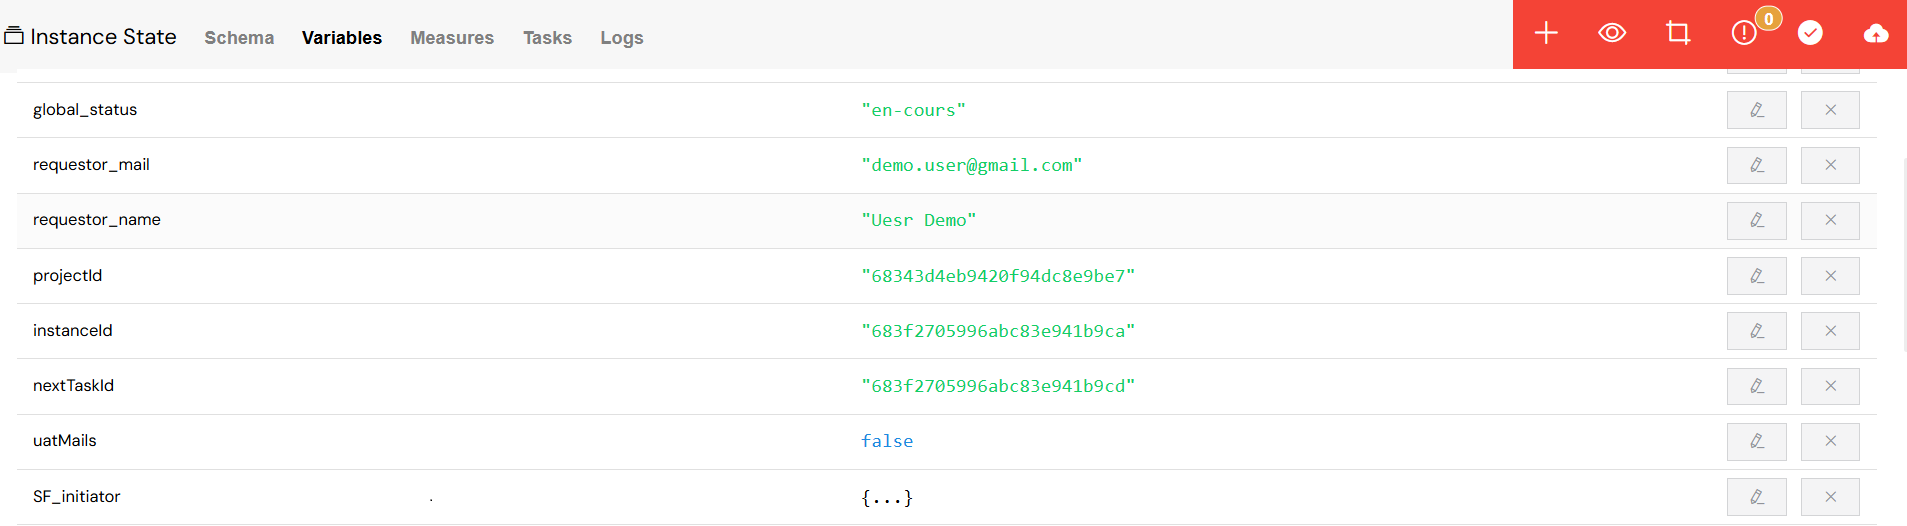
Variable Operations
- View: Display all process variables with their current values
- Edit: Modify variable values inline or with JSON editor
- Add: Create new variables with type specification (string, number, array, json)
- Delete: Remove variables with confirmation
Variable Types Support
- String values: Direct text input
- Boolean values: Checkbox interface
- Date values: Date picker
- Numeric values: Number input with validation
- Objects/Arrays: Advanced JSON editor with syntax highlighting
Variable Categorization
- Master Variables: Main process variables
- Branch Variables: Parallel gateway branch-specific variables
- Duration Variables: Automatically calculated timing metrics
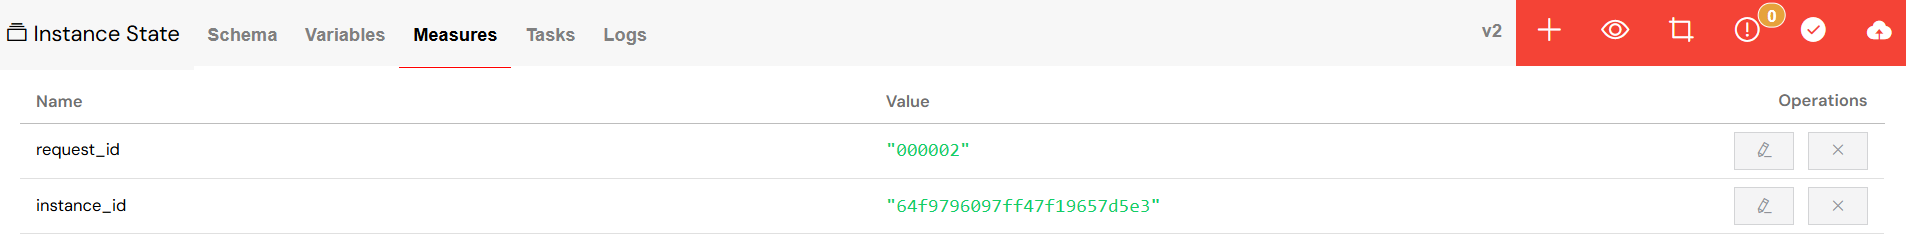
5.3 Measures Management
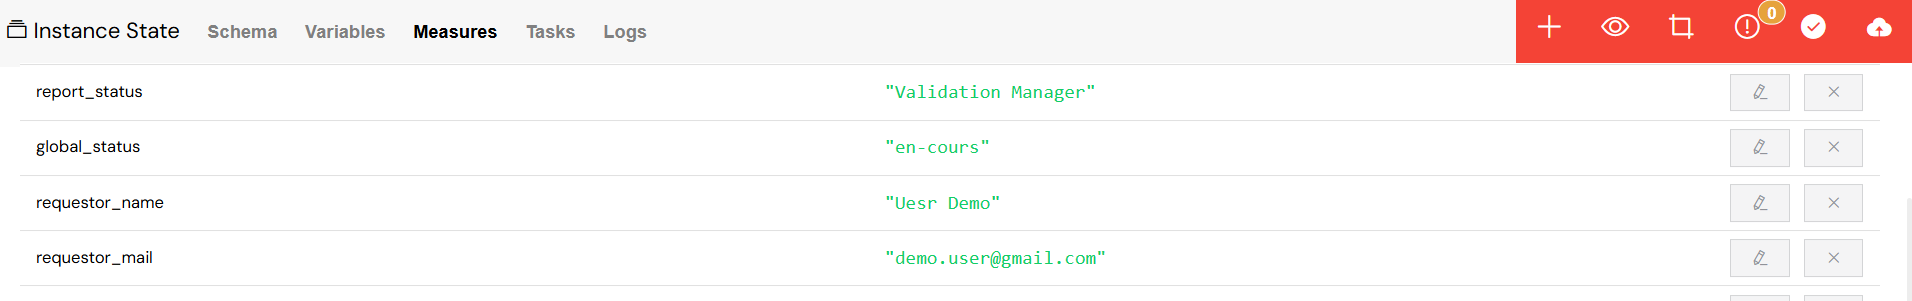
Performance Metrics
- View calculated KPIs and performance indicators configured in process design
- Edit measure values for recalculation scenarios
- Add custom measures with specific values
- Track SLA compliance and duration metrics
Operations
- Inline editing for simple measure types
- JSON editor for complex measure objects
- Real-time value updates
5.4 Tasks Management
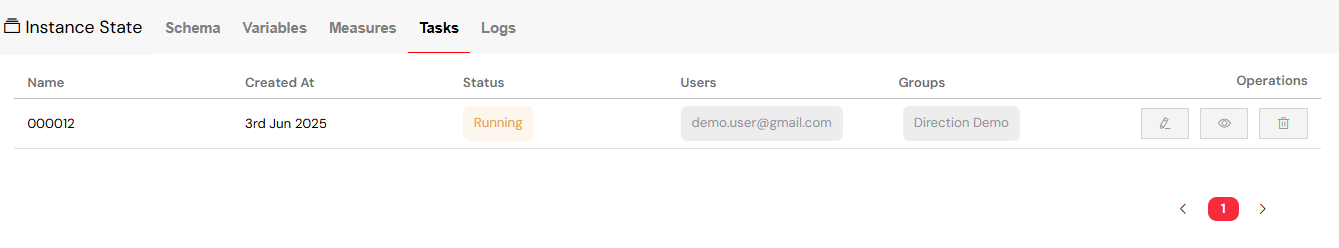
Task Oversight
- Task List: View all user and system tasks
- Task Properties:
Task Operations
- Edit: Modify task assignments (users and groups)
- View: Open task interface in new tab
- Delete: Remove tasks with confirmation
- Update Status: Change task execution state
Assignment Management
- Multi-select user assignment with search
- Group assignment with visual group management
- Dynamic user/group loading for large organizations
5.5 Sub-processes Management
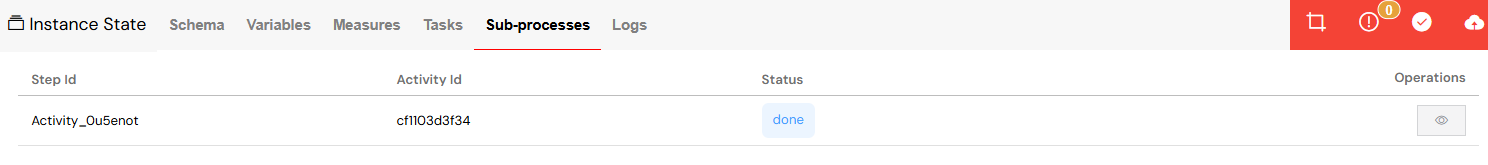
Child Instance Tracking
- View all spawned sub-process instances
- Track sub-process status and relationships
- Navigate to child instance details
- Monitor parallel execution flows
Sub-process Information
- Step ID and Activity ID mapping
- Status inheritance from parent process
- Direct access to child instance management
5.6 Comprehensive Audit Logs
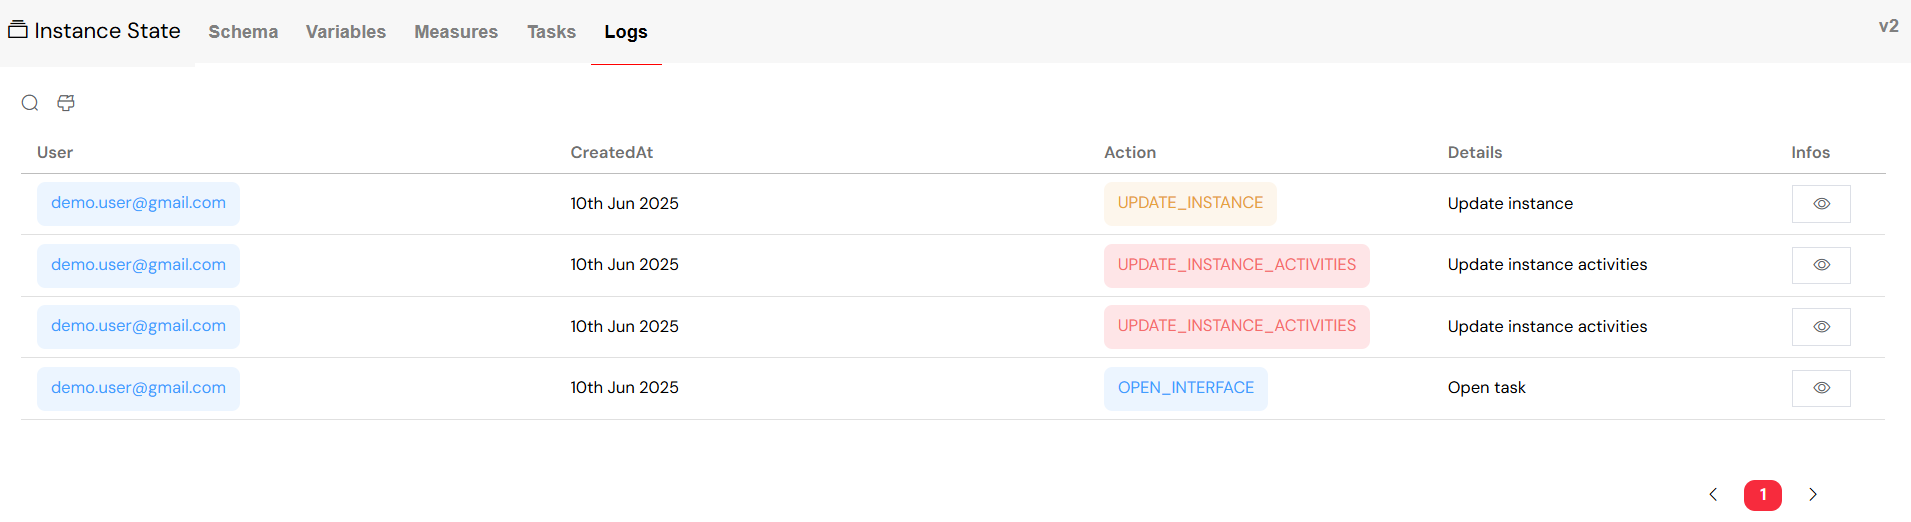
Log Categories
- Process Actions: START_PROCESS, RESUME_INSTANCE
- Instance Updates: UPDATE_INSTANCE, UPDATE_INSTANCE_MEASURES, UPDATE_INSTANCE_ACTIVITIES
- Task Operations: VALIDATE_TASK, UPDATE_TASK, DELETE_TASK
- Interface Access: OPEN_INTERFACE tracking
Log Features
- Advanced Filtering:
- User-based filtering with search
- Date range selection
- Action type filtering
- Details text search
- Detailed Information: Full object information for each log entry
- Pagination: Efficient navigation through large log sets
Log Analysis
- User activity tracking
- Timestamp-based analysis
- Action pattern identification
- Debugging support with full context
6. Advanced Instance Operations
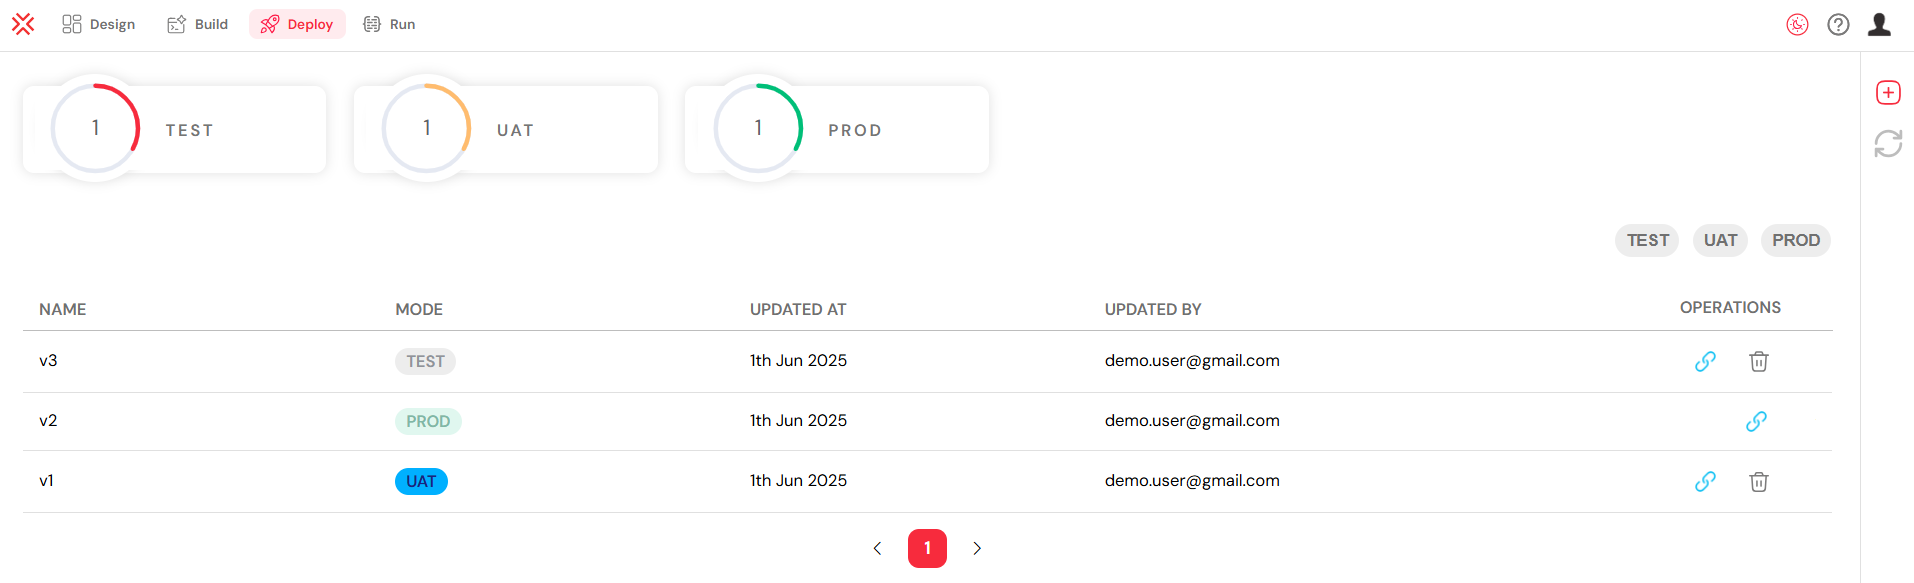
Version Management
- Current Version Display: Shows active process version
- Version Switching: Update instances to newer process versions
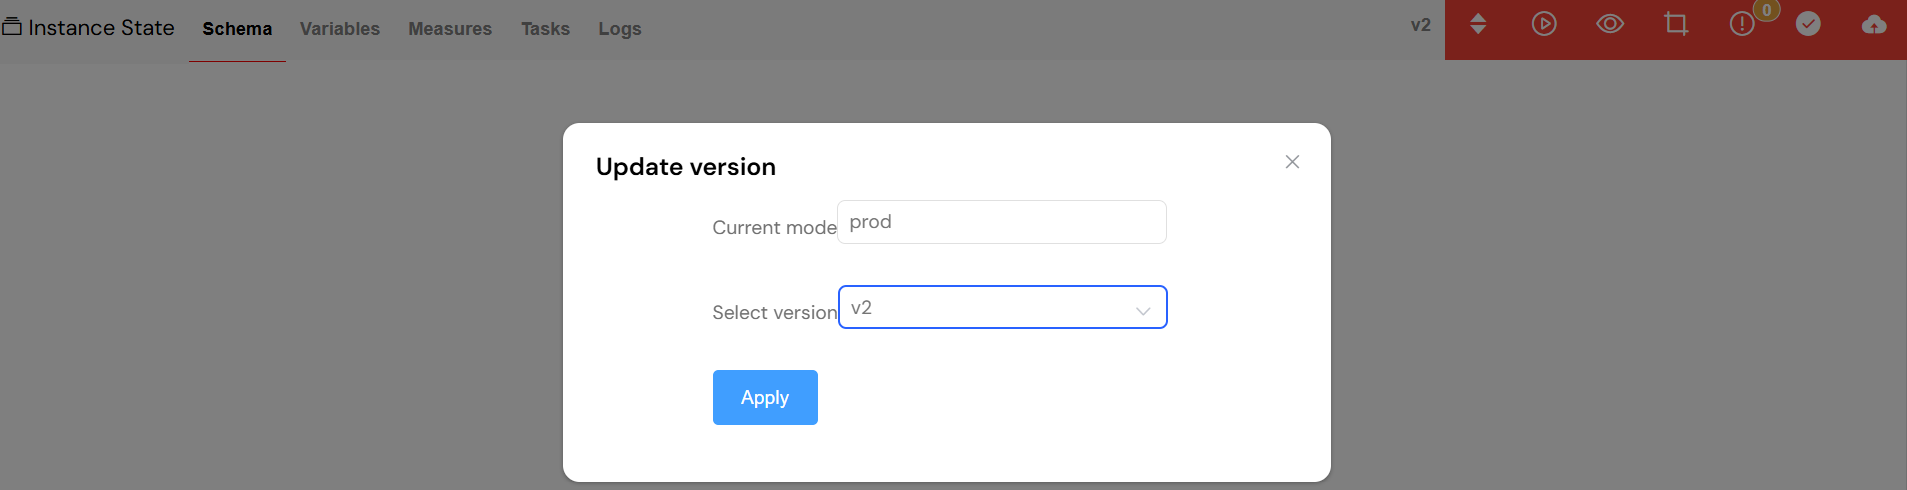
- Version History: Access to all available versions per environment
Error Handling & Recovery
- Error Visualization: Failed activities highlighted in red
- Error Details: Comprehensive error information with stack traces
- Recovery Options: Multiple paths to resolve instance issues
- Manual Intervention: Direct control over stuck processes
Activity Flow Control
- Manual Activity Addition: Add missing activities to running instances
- Parallel Gateway Handling: Proper branch variable management
- Flow Resumption: Resume from specific activities
- Status Override: Manual status changes for recovery scenarios
7. Instance Lifecycle States
| Status | Description | Visual Indicator |
|---|---|---|
| Running | Process actively executing steps, waiting on user tasks, conditions, or scheduled timers | Orange |
| End | All activities of the instance were executed successfully. | Green |
| Error | The instance is in an error state | Red |
| Pause | Execution paused (waiting for external input or reactivation) | Blue |
8. Performance Features
Efficient Data Loading
- Progressive Loading: Load data as needed to maintain responsiveness
- Timeout Protection: Prevent browser freezing on large datasets
- Background Operations: Non-blocking operations for better user experience
Real-time Updates
- Status Synchronization: Real-time status updates across all views
- Activity Highlighting: Immediate visual feedback on process changes
- Log Streaming: Live log updates for active monitoring
This comprehensive Run & Instance Management system provides complete control over your process execution environment, from high-level monitoring to granular instance manipulation, ensuring efficient process operations and rapid issue resolution.
Run & Instance Integration
Development Integration
Run management integrates with development workflows:
- Project Setup: Monitor projects and their process executions
- Web Interface Design: Track interface usage and user interactions within processes
- Process Design: Monitor and debug process execution in real-time
- Database Integration: Track database operations within process flows
- Integration: Monitor external API calls and system integrations during process execution
- Reporting: Generate reports on process performance and execution patterns
- Test & Deploy: Monitor processes across different environments
- Monitor & Run: Coordinate with development monitoring tools
Administration Integration
Run management works with all administrative features:
- User Management: Track which users are executing processes and assign tasks
- Role Management: Monitor role-based task assignments and process access
- Authentication: Ensure secure access to process management features
- Settings: Use platform settings for process configuration and monitoring
- Mail Management: Send process notifications and error alerts
- Instances Monitoring: Coordinate with high-level monitoring dashboards
- System Logs: Cross-reference detailed process logs with system activity
- Home Redirection: Route users to appropriate process dashboards based on their context
Operational Excellence
Use run management for operational optimization:
- Process Performance: Identify bottlenecks and optimization opportunities
- Resource Planning: Plan system resources based on process execution patterns
- User Training: Identify areas where users need additional training or support
- Business Intelligence: Extract business insights from process execution data
Next Steps
Continue optimizing your process operations:
Advanced Monitoring:
- Instances Monitoring - High-level monitoring with automated alerting
- System Logs - Comprehensive audit trails and system analysis
- Settings - Configure monitoring preferences and thresholds
- Mail Management - Set up automated process notifications
Administration Optimization:
- User Management - Optimize user assignments based on process execution patterns
- Role Management - Refine role assignments based on actual process usage
- Authentication - Secure process management access
- Home Redirection - Create process-specific landing pages for different user roles
Development Enhancement:
- Project Setup - Optimize project configurations based on execution data
- Web Interface Design - Improve interfaces based on process interaction patterns
- Process Design - Optimize processes based on execution analytics
- Database Integration - Optimize database operations based on process performance
- Integration - Improve external integrations based on execution patterns
- Monitor & Run - Coordinate development and operational monitoring